The Aretas IoT RTLS software platform can ingest data from any RTLS system. The Aretas RTLS system is also the only cloud based system that supports ANY sensor data and advanced analytics. Low latency / high speed real-time RTLS. White label and custom configurations available.
Aretas RTLS Standard Software Features:
Real Time Location
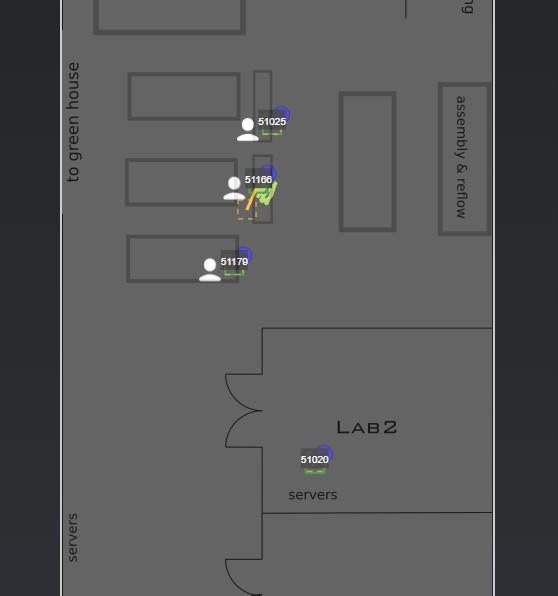
First and foremost is low-latency real time location capabilities in your browser.
View any location, any tag, any asset, anywhere on the globe. In real time. Track asset locations, worker location and more.
Supports multiple locations, multiple maps per location and global access.
Real time location data filtering, activity classification and collision detection are just some of the features available
Tag Sensor Data Support
View real-time sensor data from tags. Temperature, relative humidity, toxic gases and more. Supports any sensor. Store sensor data for long term analytics. Supports wearable sensors and stationary sensors.
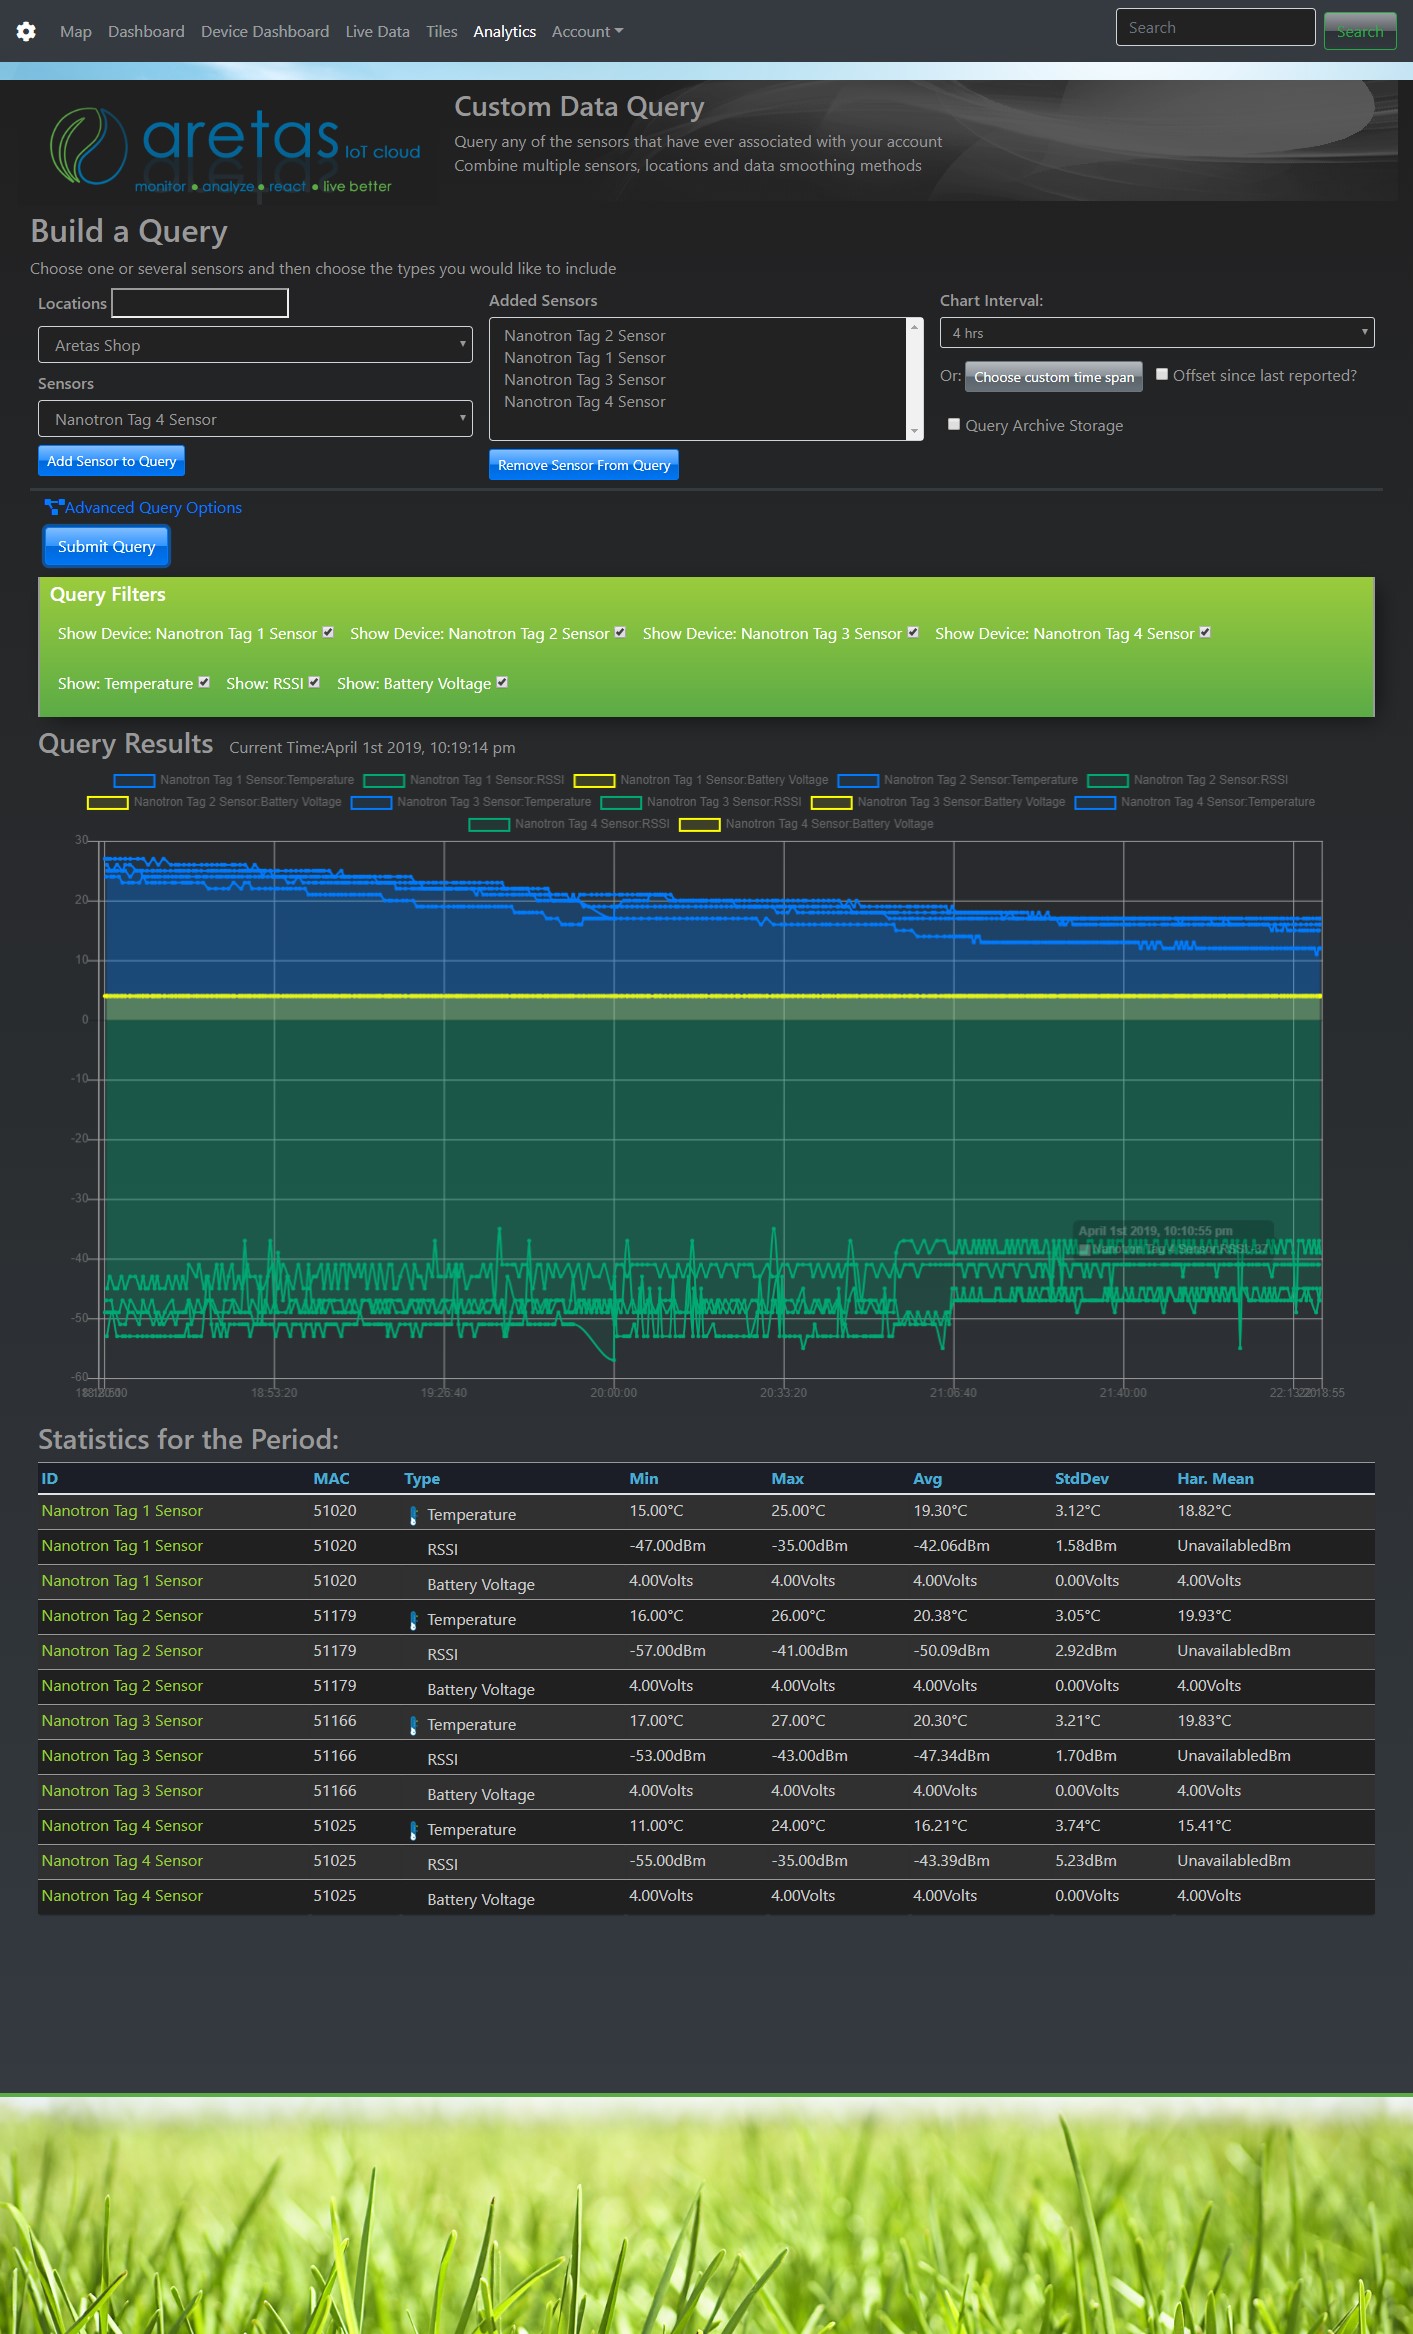
Tag Sensor Analytics
Query historical tag sensor data such as temperature, RSSI, battery voltage, etc.
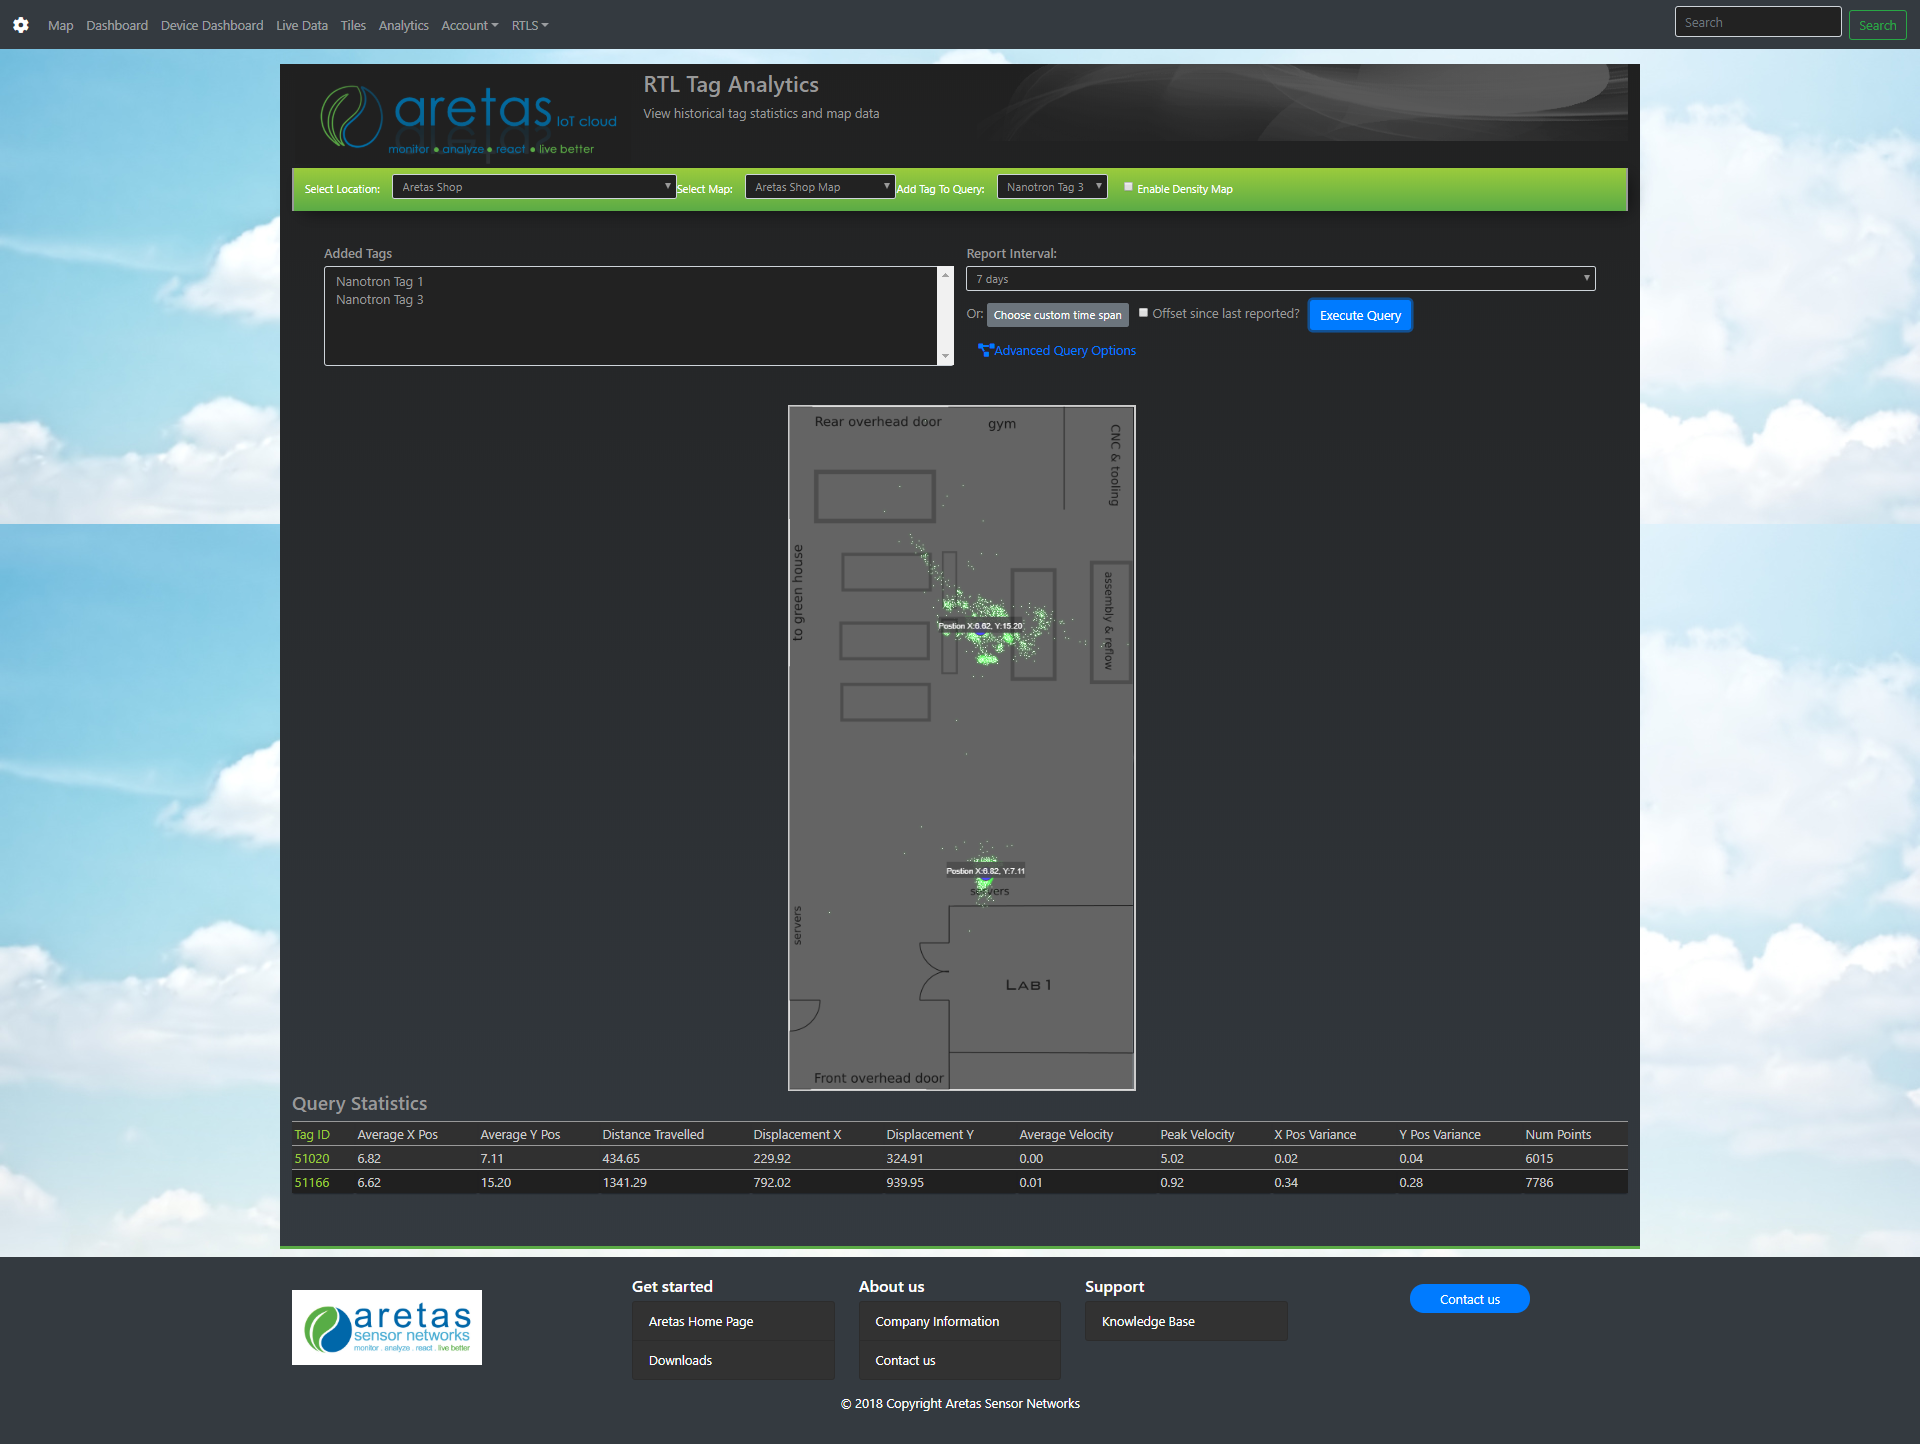
Historical Tag Analytics
View where a tag has been throughout a period. For example:
View where an employee has been throughout the day
Track equipment usage
Analyze how areas are used throughout a week
Analyze Manufacturing workflow
Location Density Maps
Gain deeper insights into how spaces are utilized. Density maps give you even more insight into how space is utilized and where tags have spent the most time.
Works in real time and historical views.
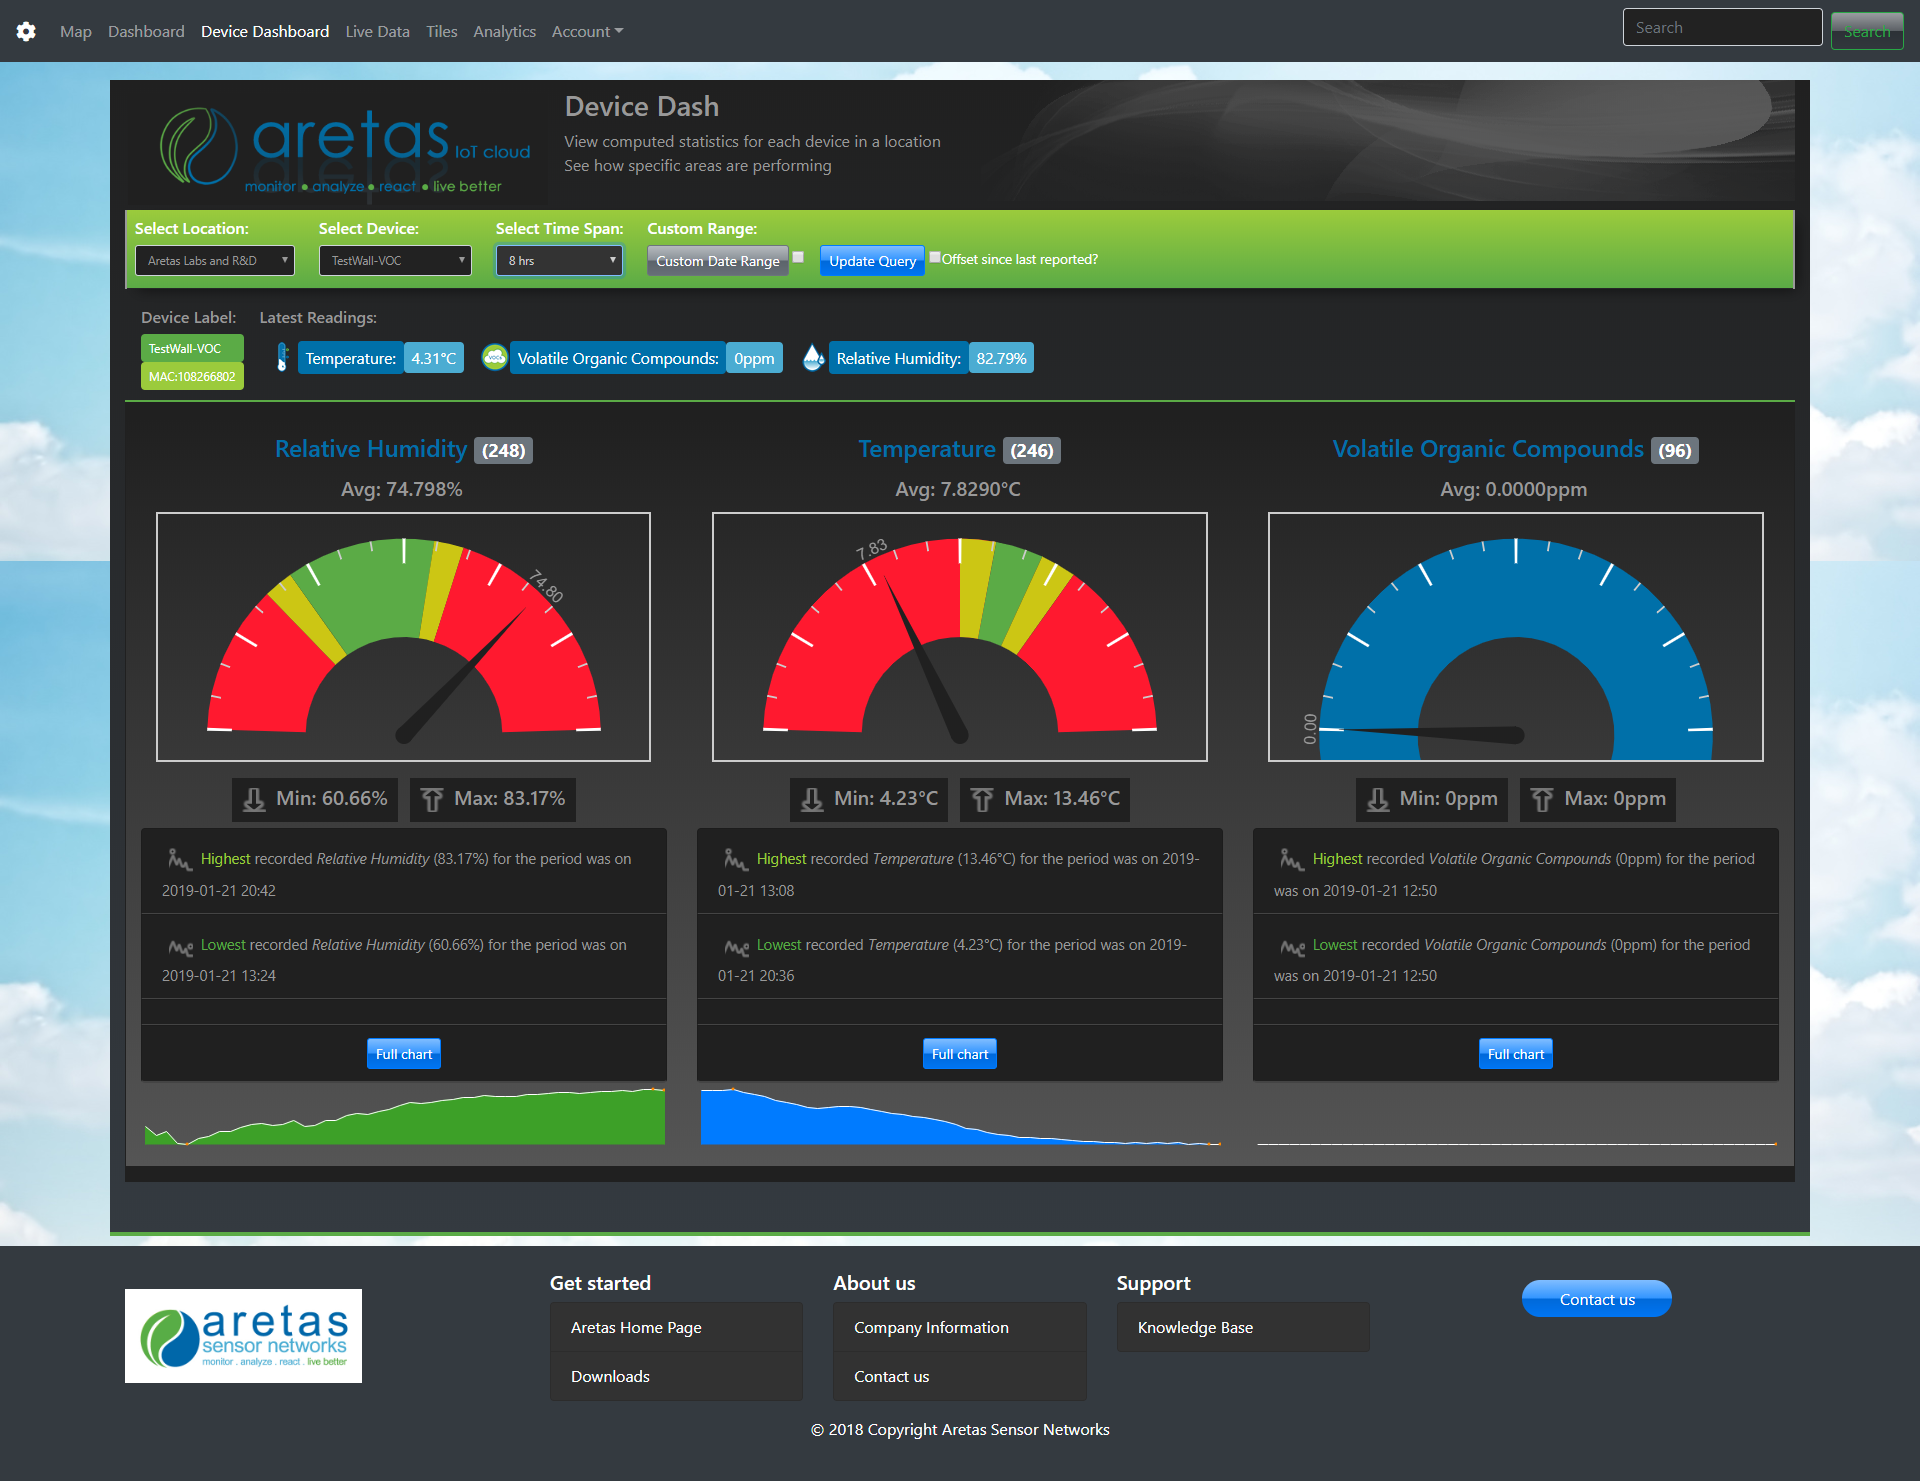
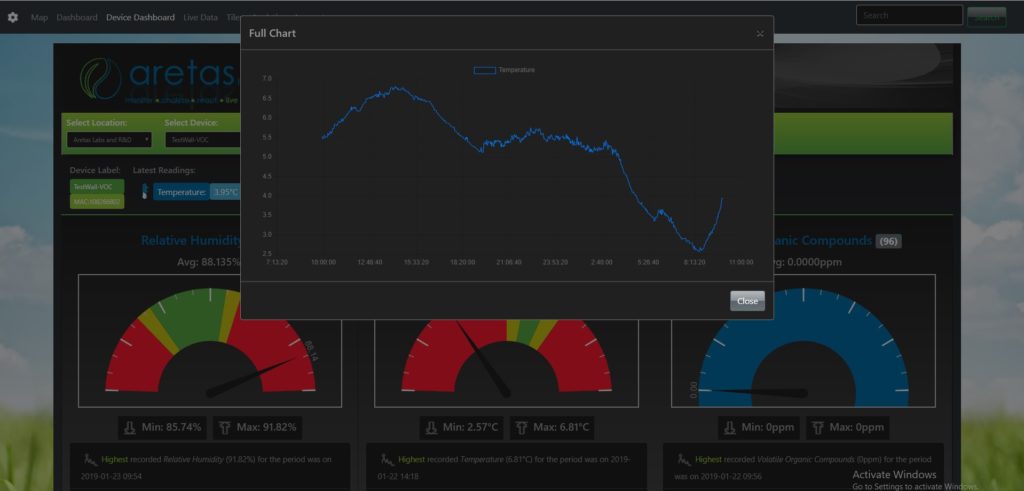
Tag Sensor Dashboard
View individual sensor performance and up to date data. Get consolidated statistics over a period for a sensor. View sparkline data and full charts. Geo locates the closest sensor to you automatically.
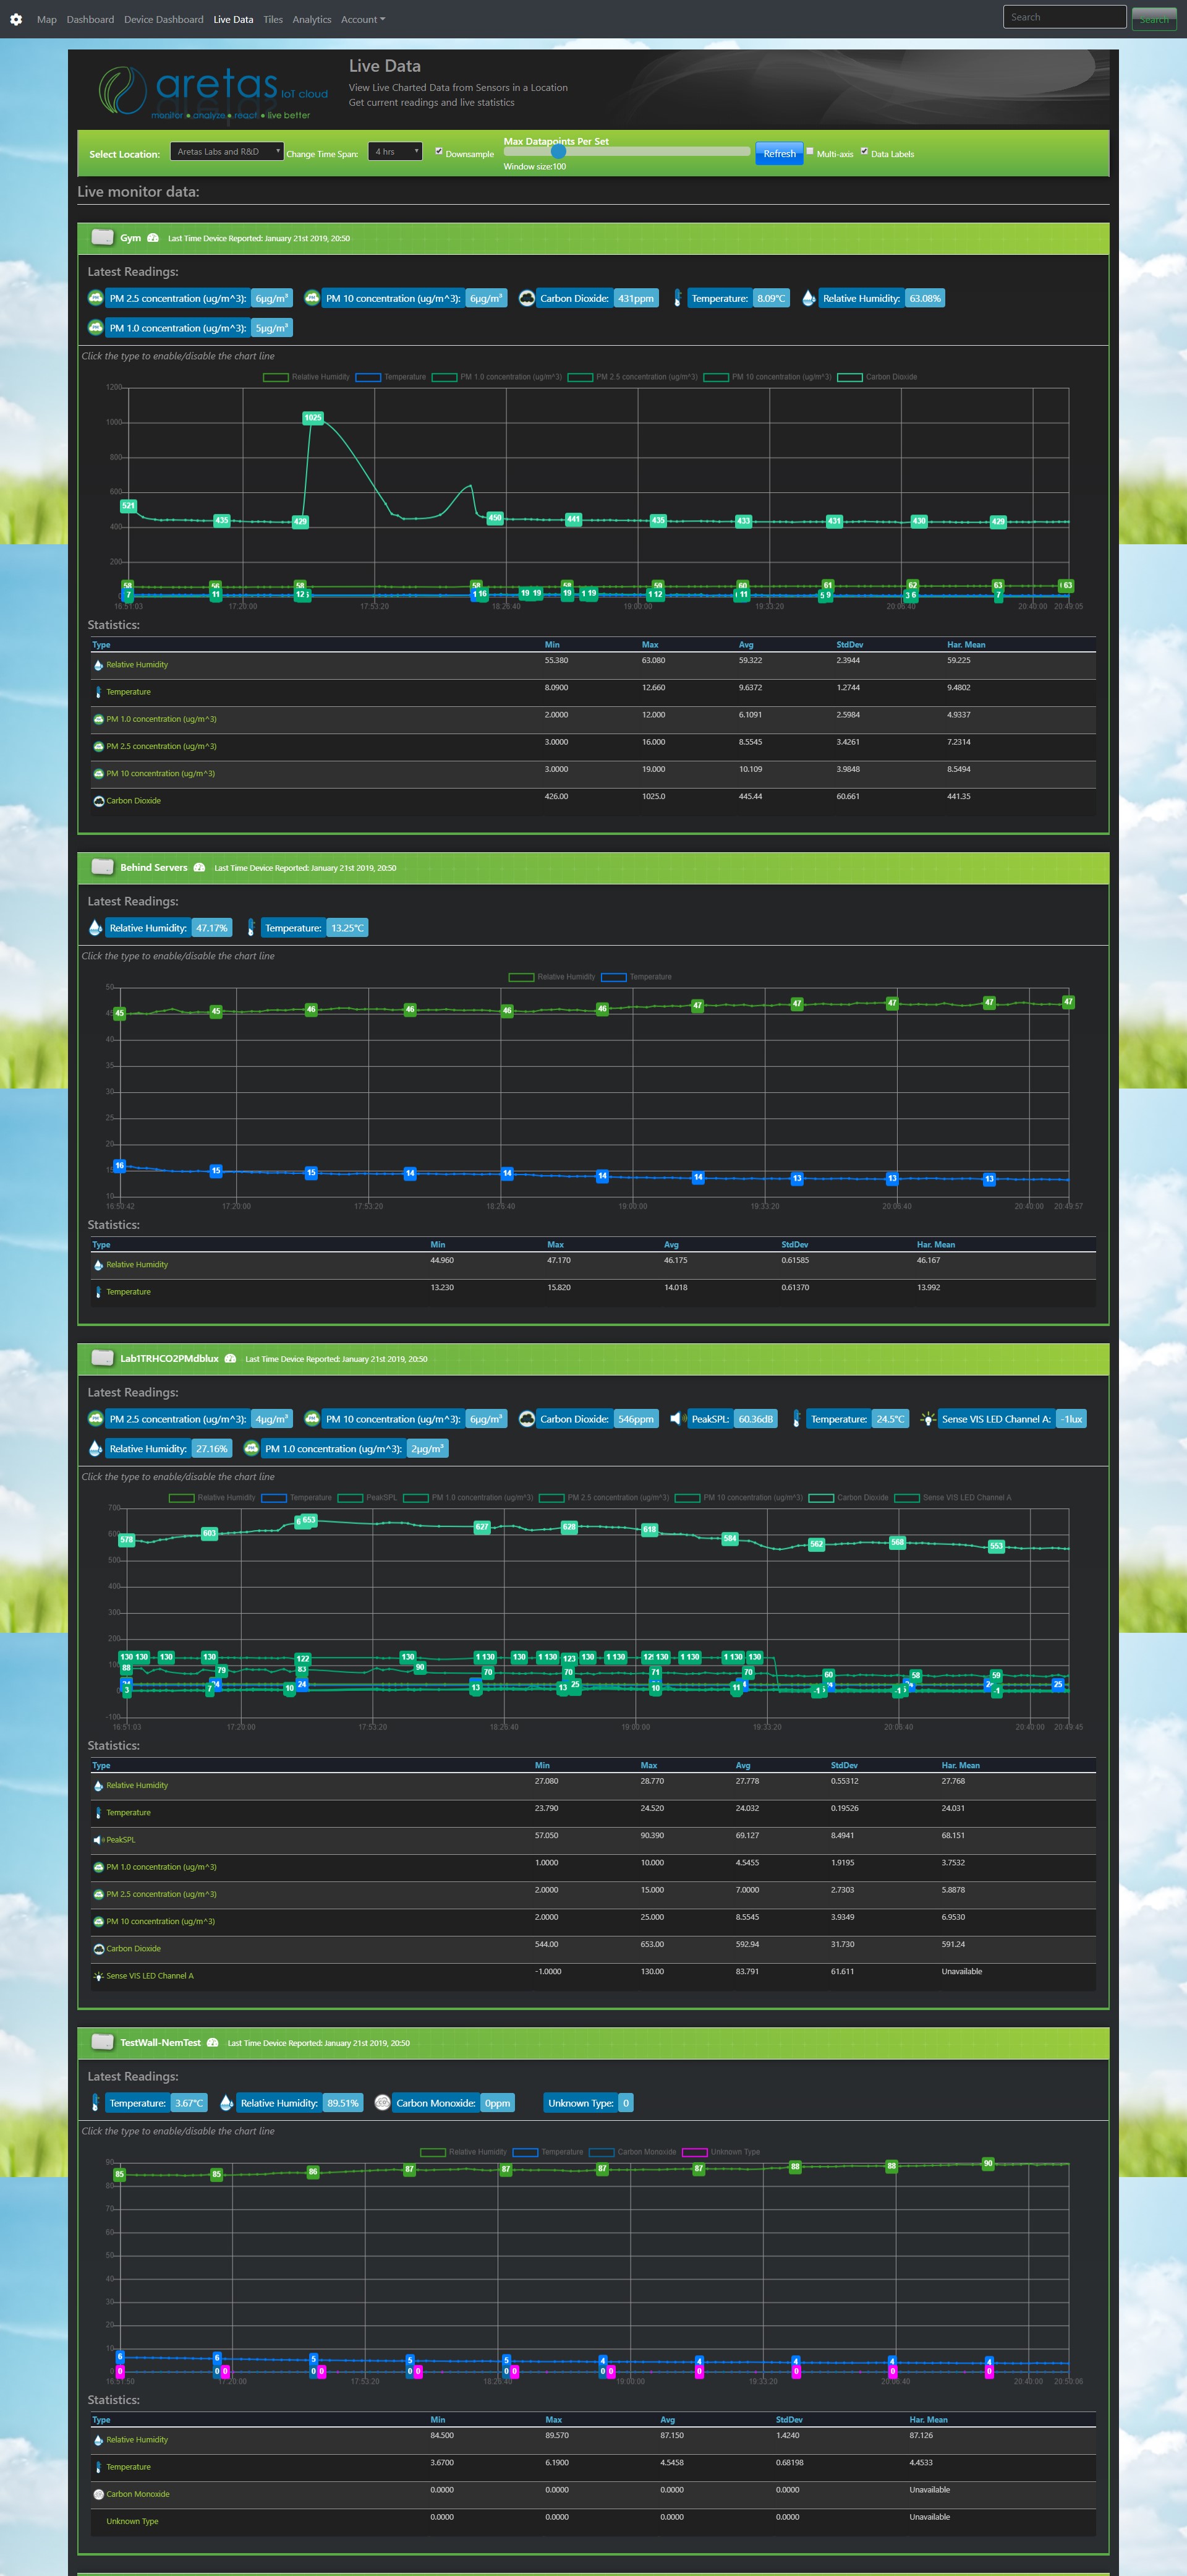
Live Data Feed
View the live data from your sensor network. Shows the current readings and charted data for the period. Choose multi-axis charting, compress data points and more. Lightning fast data queries
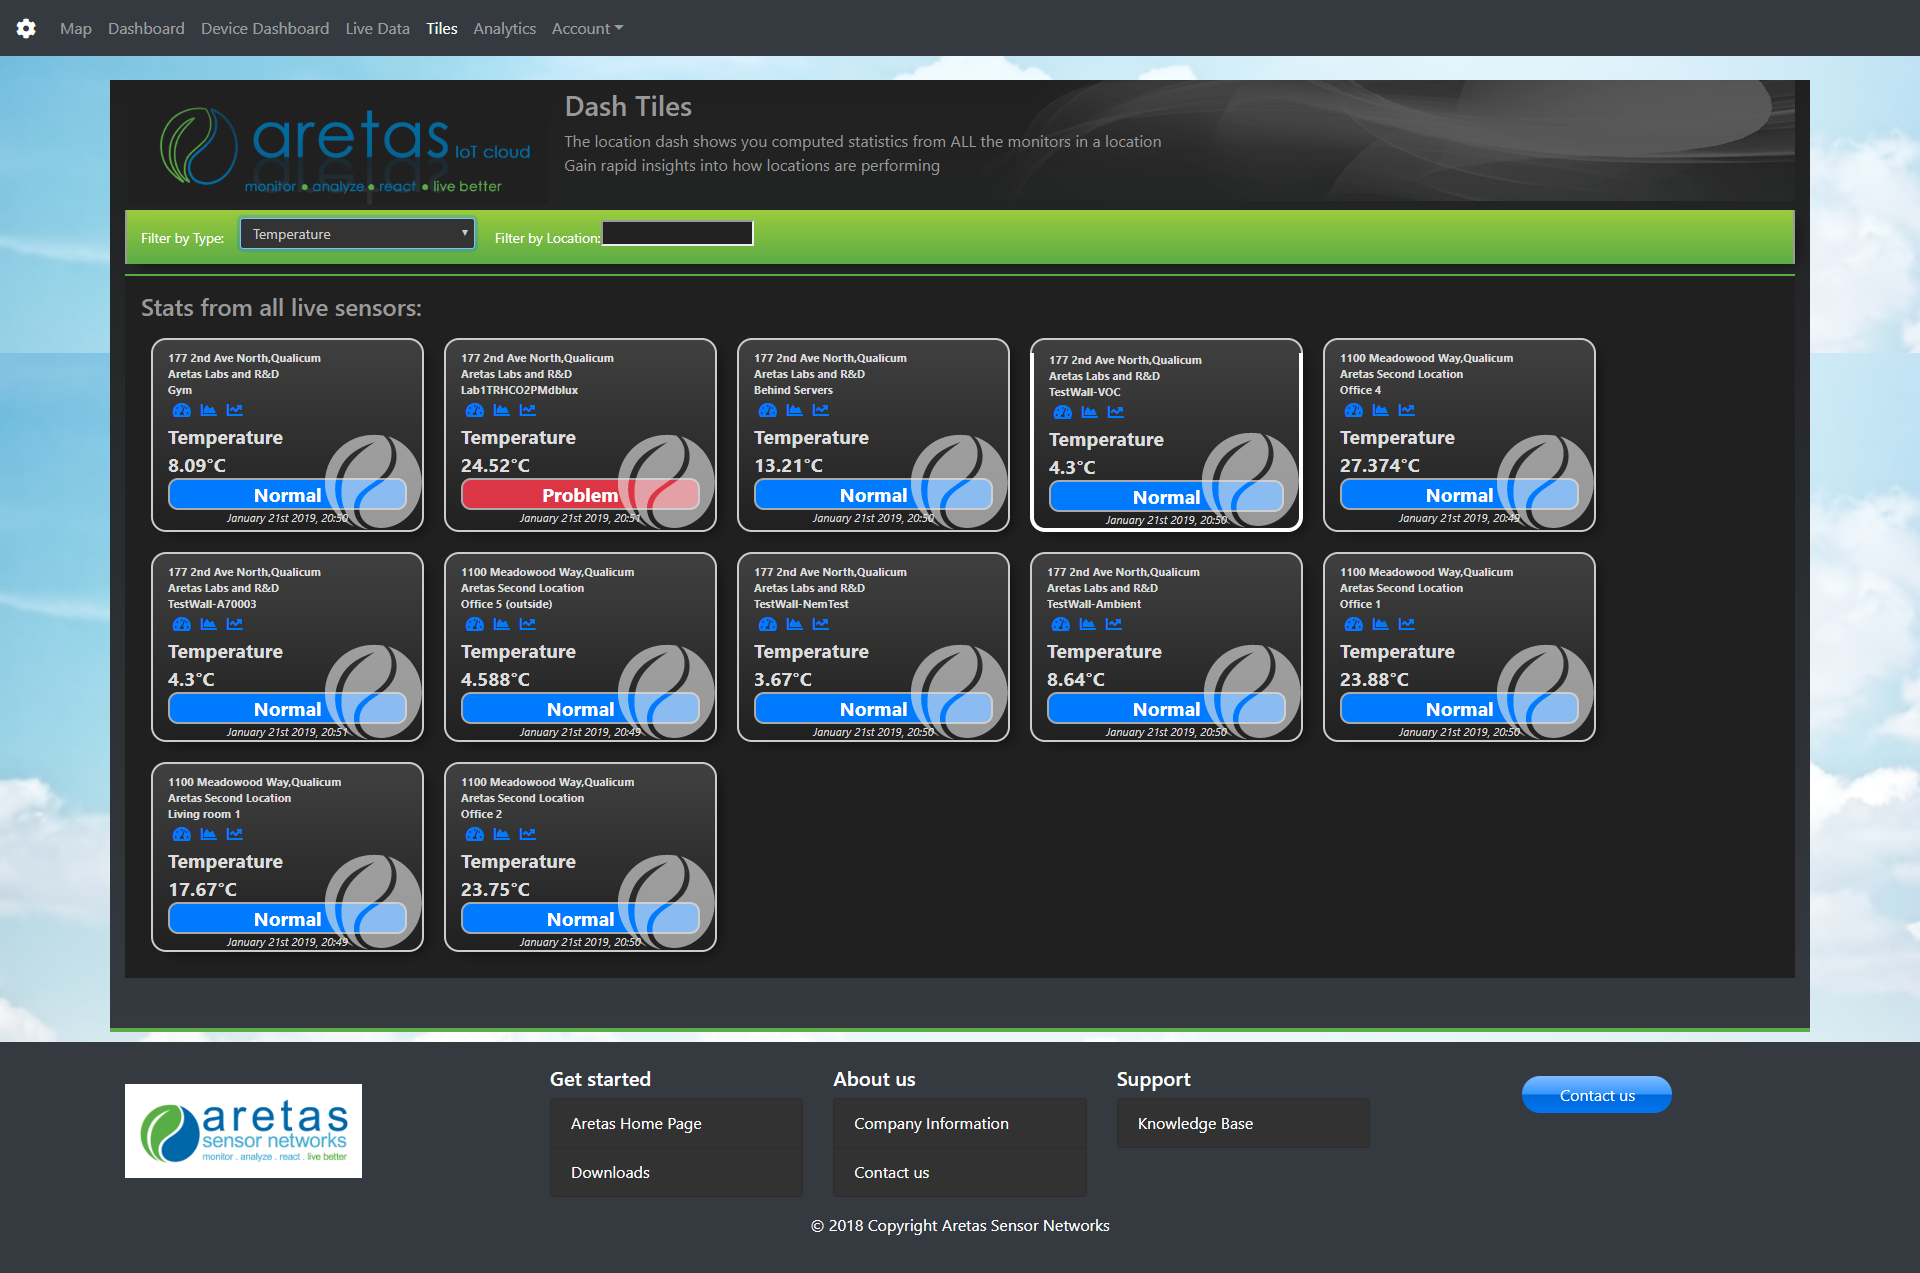
Dash Tiles
Dash tiles give you a comprehensive overview of your real time sensor data and alerts. Filter by sensor type and location.
Instantaneous Real Time sensor data with less than 1s typical delay between origin of the device reading and availability in the UI (although most sensors typically report in 1-2 minute intervals).
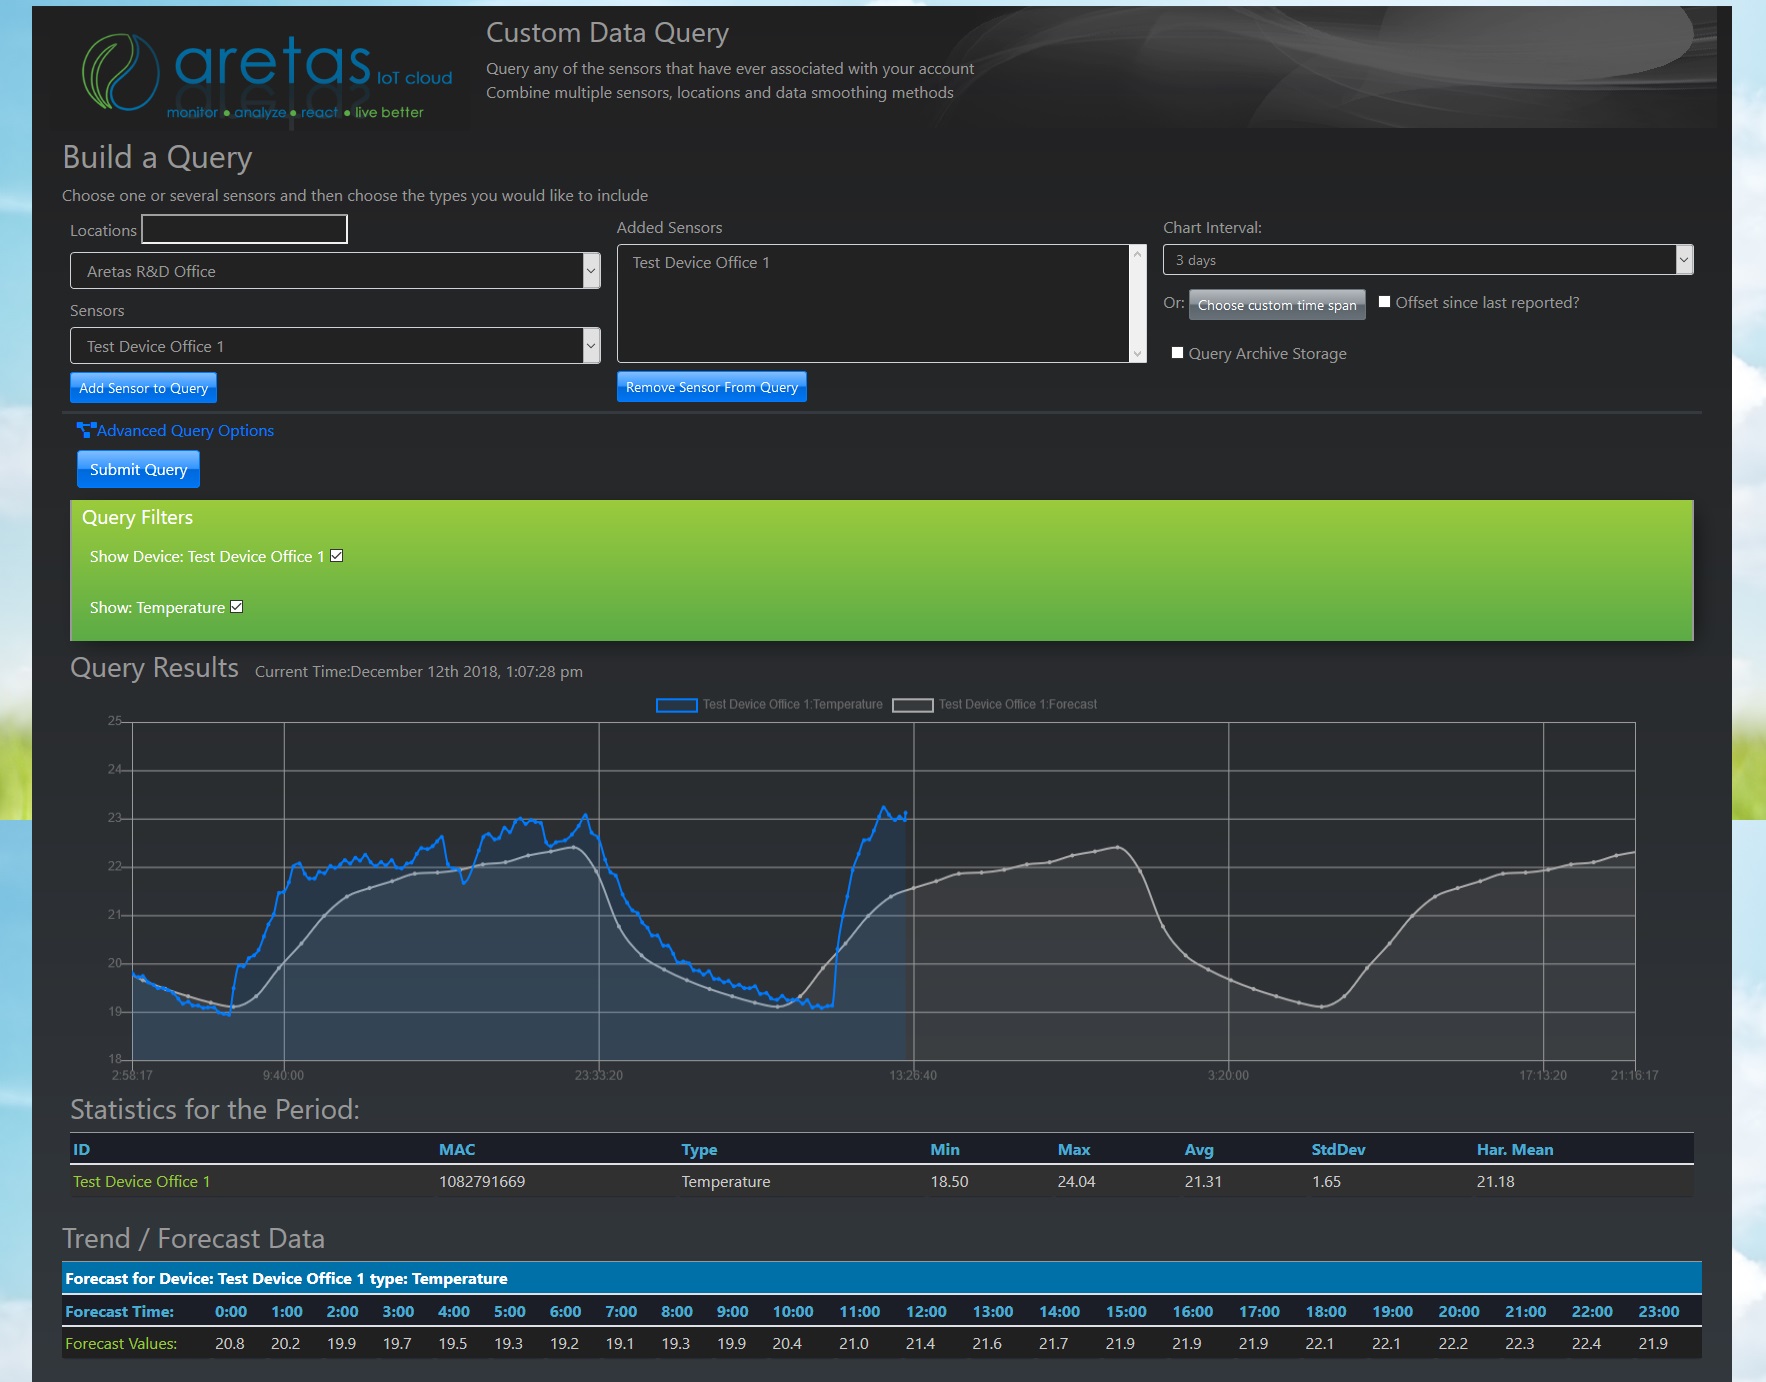
Forecasting / Prediction
Perform automatic regression over existing data and perform forecasting / prediction (works with any sensor)
Advanced features
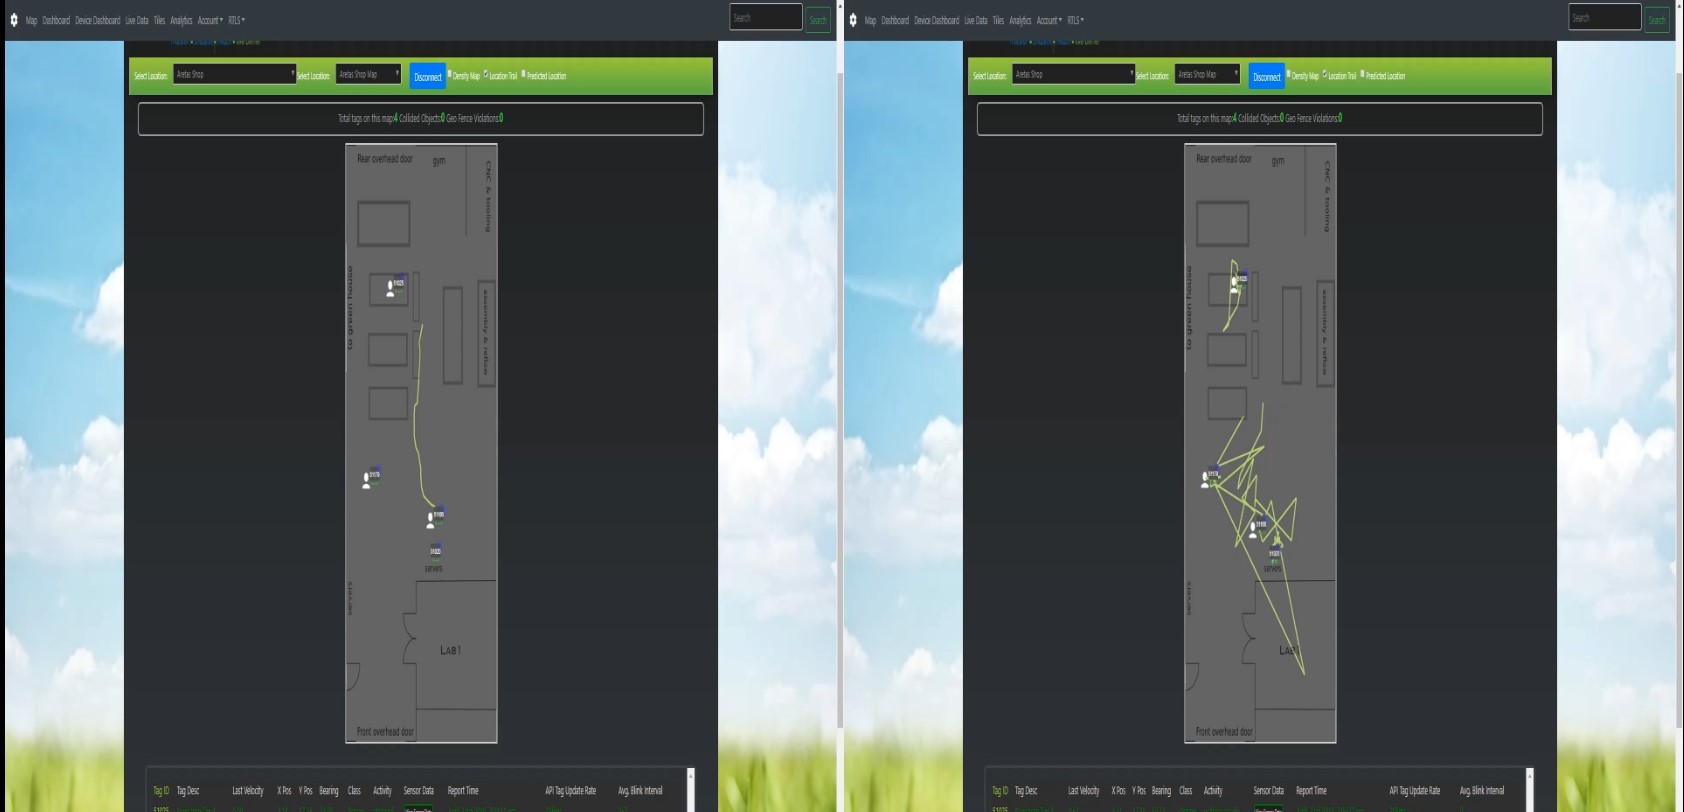
The platform can filter the noisiest tag data and still derive usable, real-time location information. The above side by side comparison shows the raw output from a demo RTLS system on the right, with the left side showing the same tag with filtering.
The platform can filter the noisiest tag data and still derive usable, real-time location information. The above side by side comparison shows the raw output from a demo RTLS system on the right, with the left side showing the same tag with filtering.
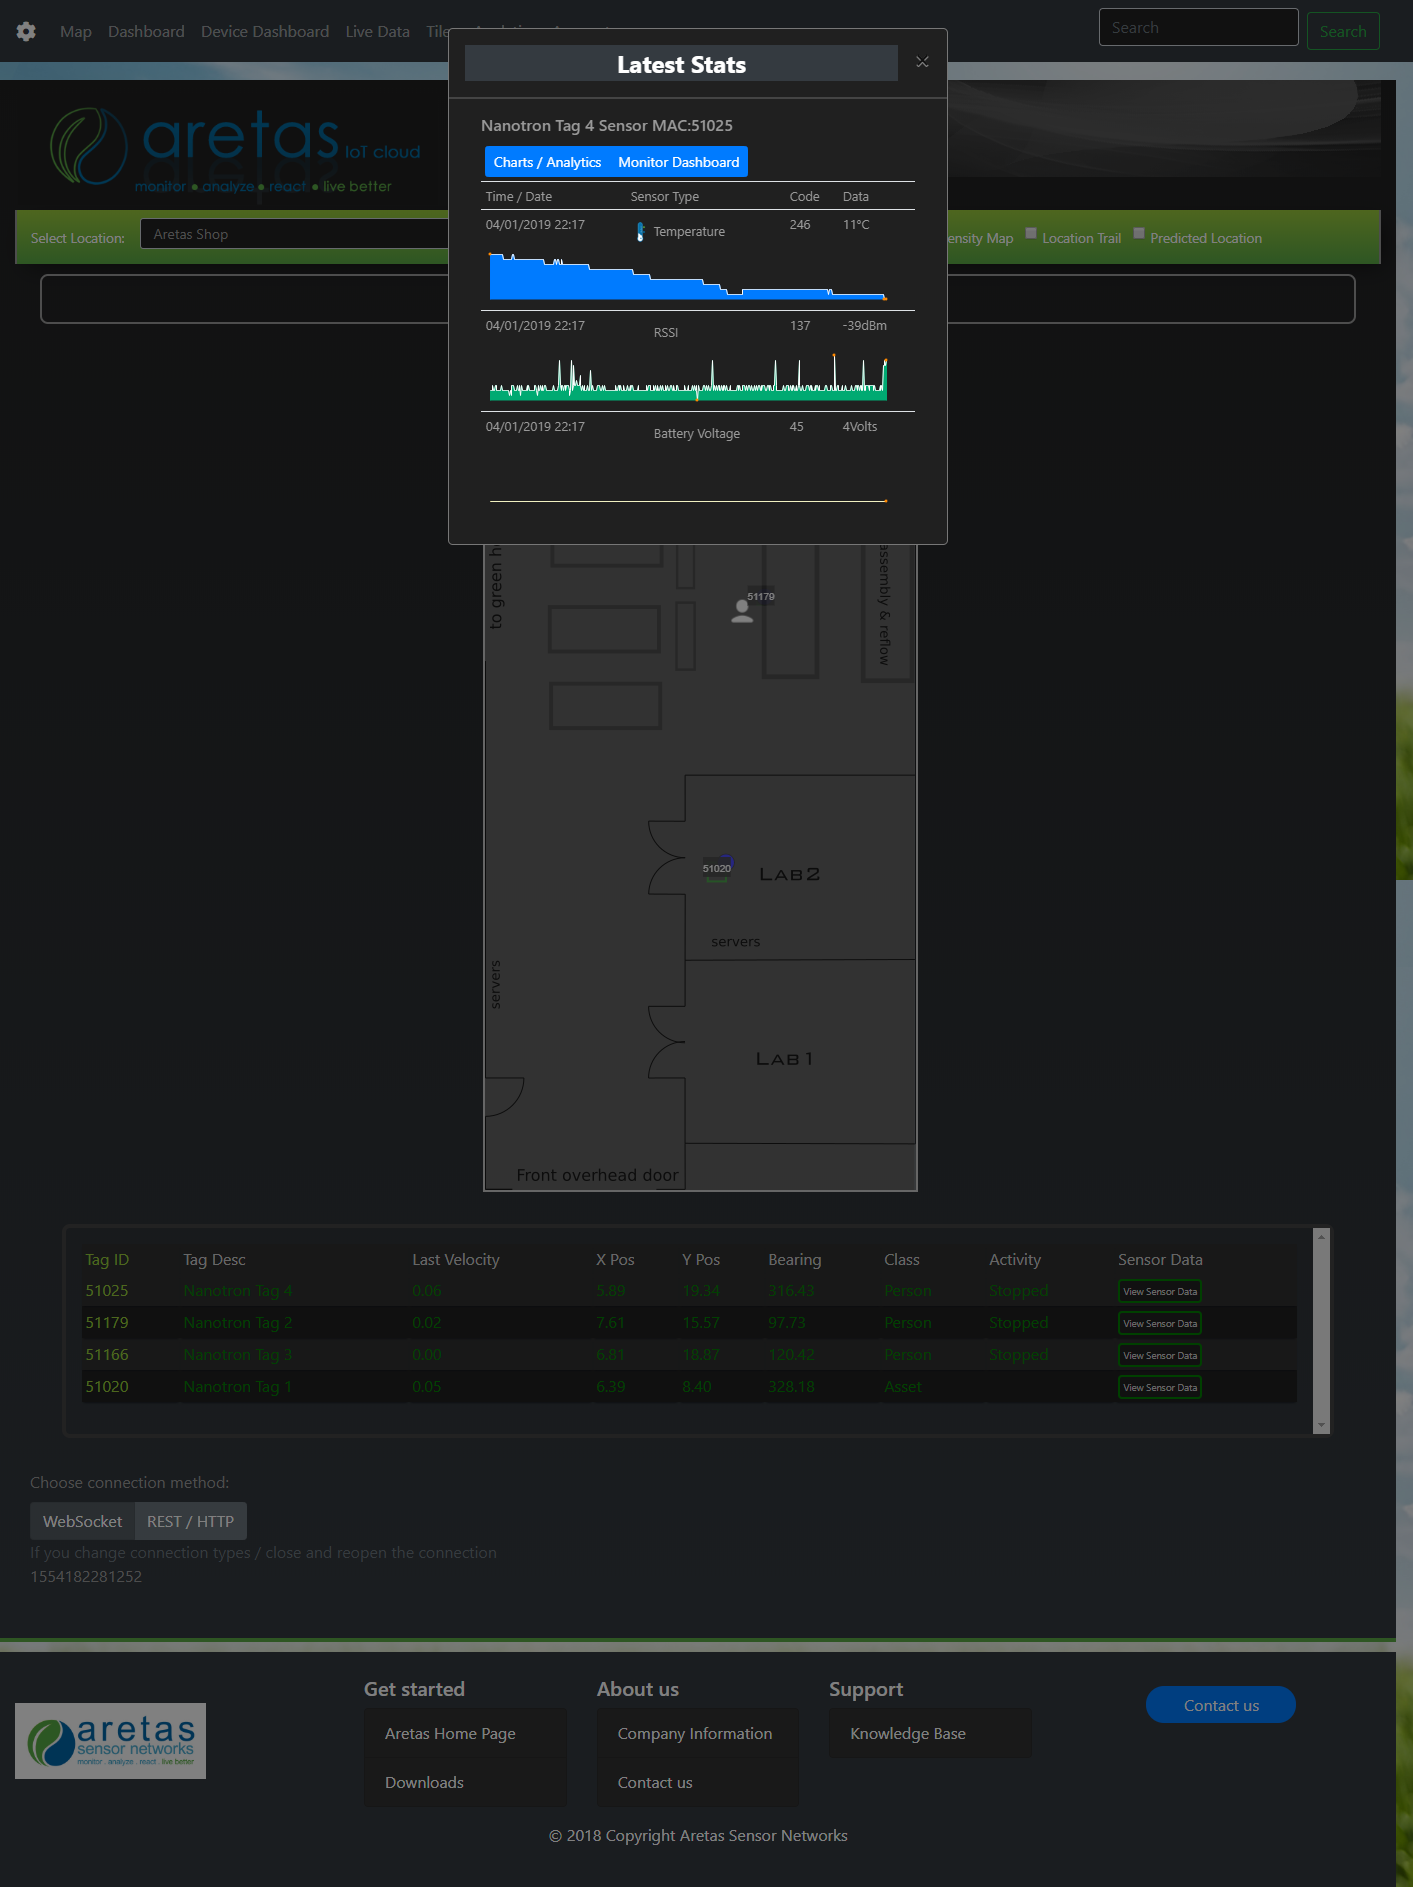
Instant, Realtime Data
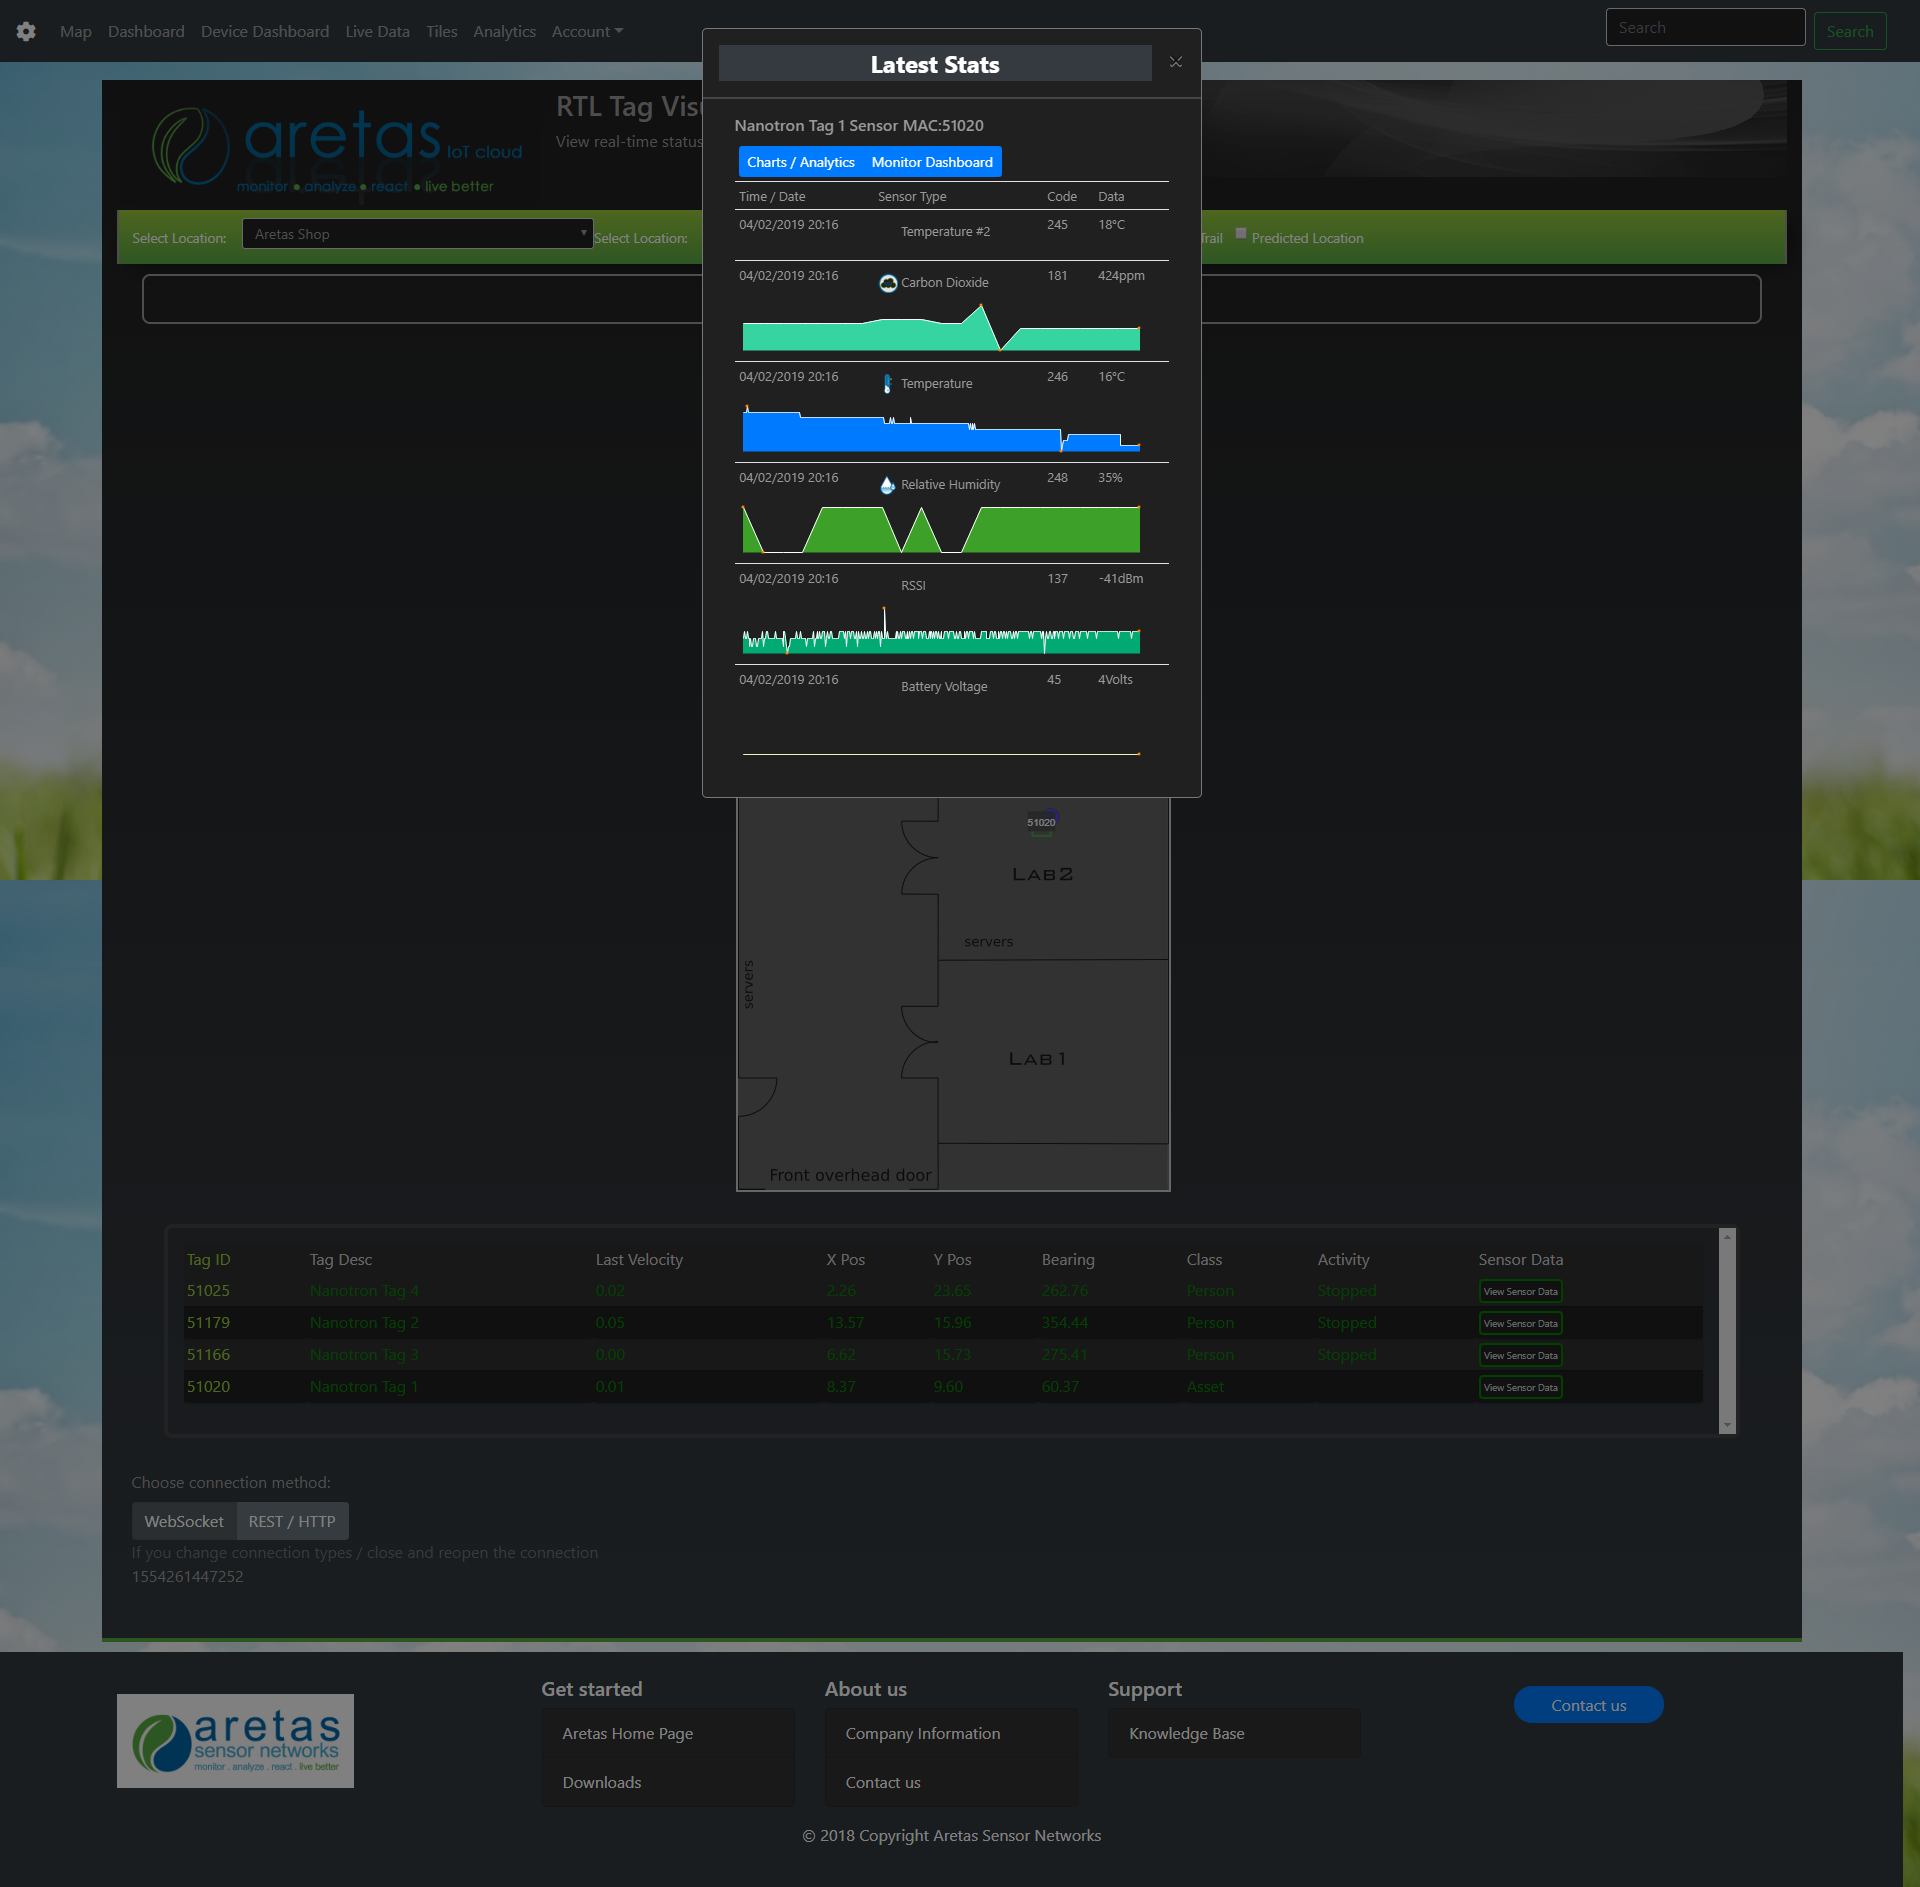
Hover over the tag and instantly view any data on the sensor in real time.
Click on tags and get instantaneous charts of any sensor attached to the tag. Perform diagnostics and analytics without leaving the page!
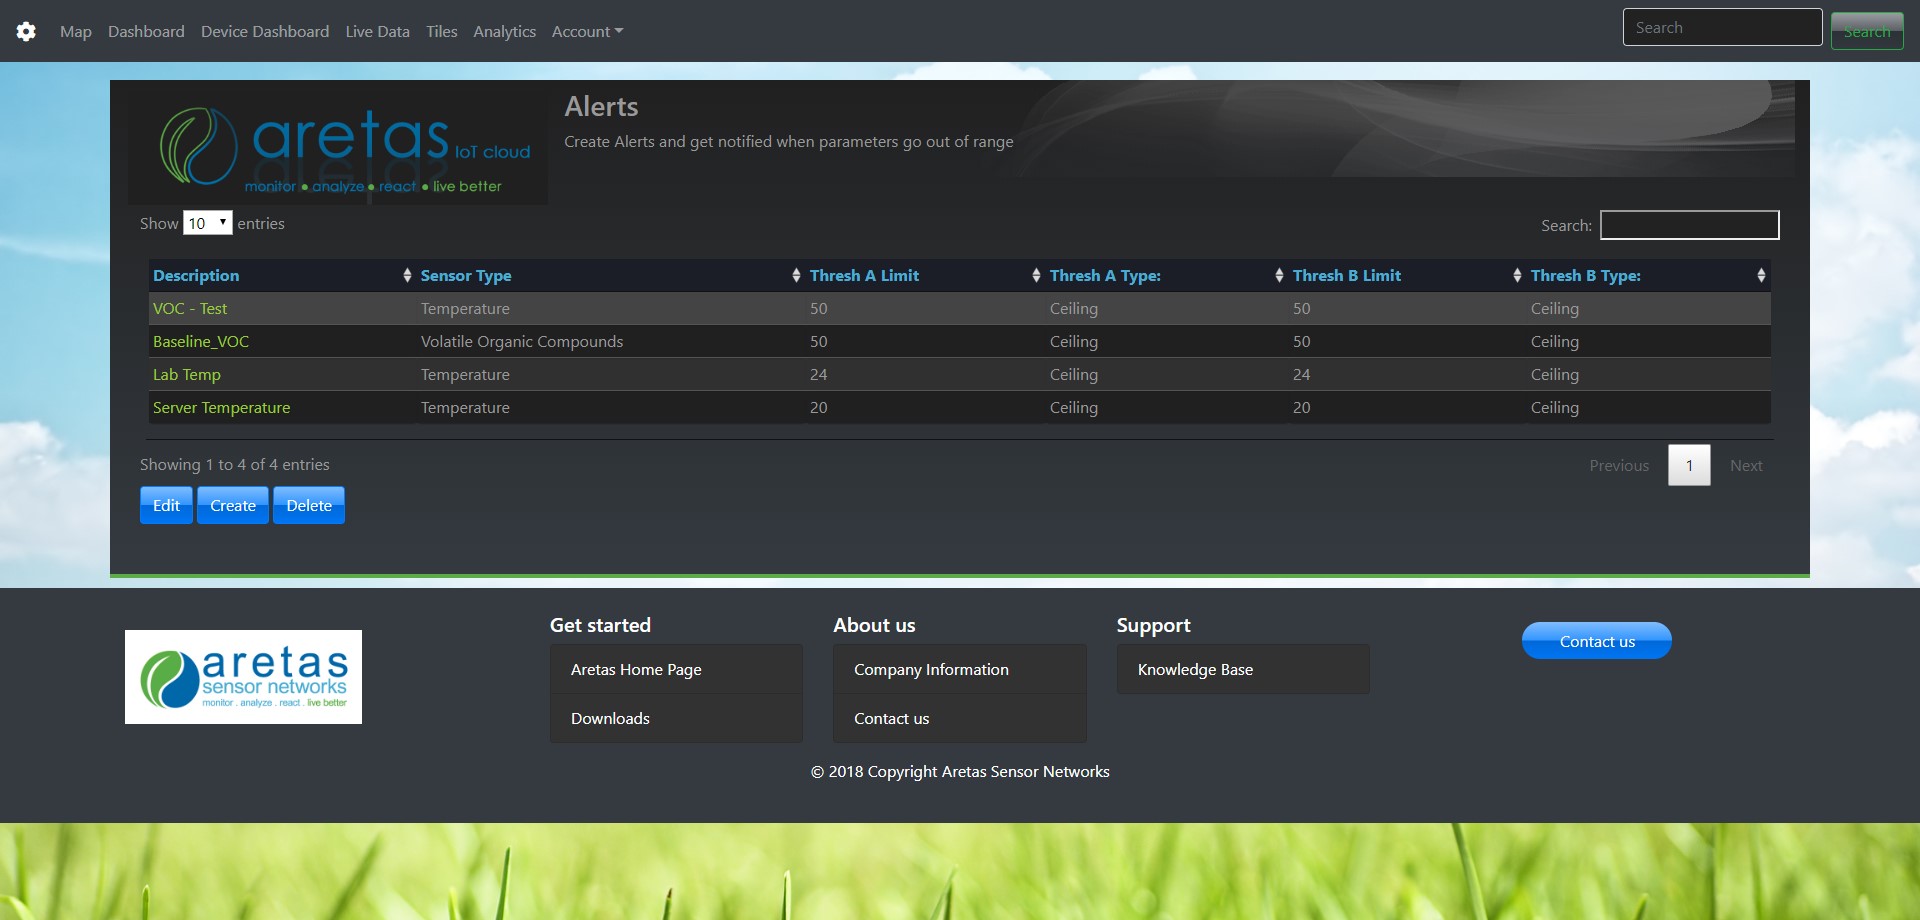
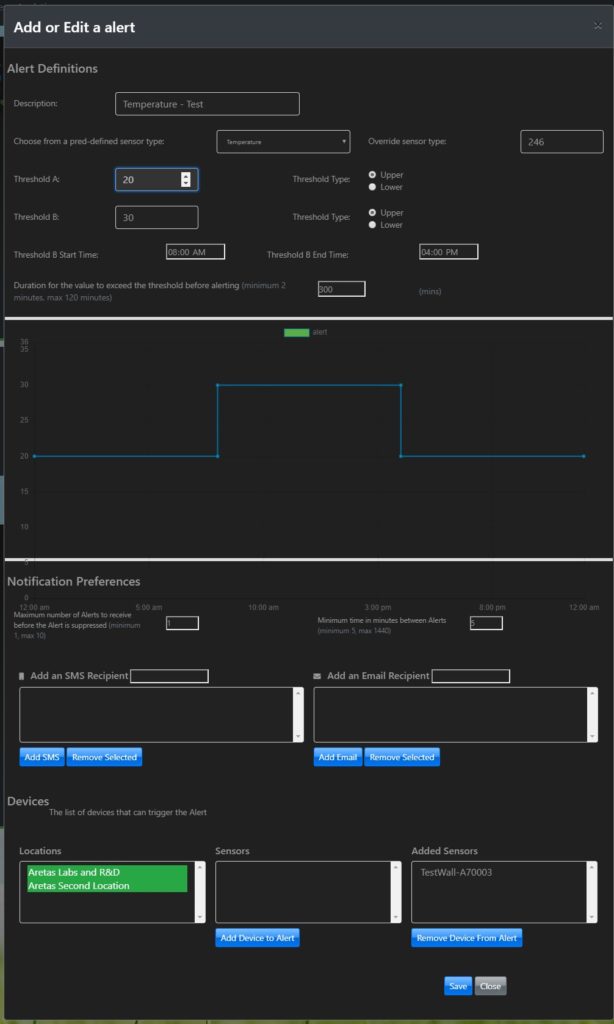
Alerts / Event Detection
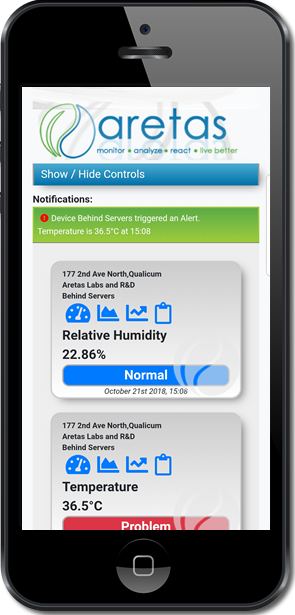
Alerts notify you when values exceed a certain threshold. Get notified by text, email and view the alerts in the web app and mobile app. Sensor statuses will turn red in both apps when the alert is triggered. You can set daytime/nighttime thresholds and alert when conditions go over or below thresholds.
Mobile Friendly
Almost all the Aretas IoT Cloud features are compatible with mobile devices (smartphone, tablet, etc). Apps are also available and can be customized to your requirements.