Aretas IoT Cloud

The Aretas IoT Cloud Platform is the best end-to-end solution available on the market today. Machine Learning, Forecasting, Advanced Time Series Databases, Alerting & Control, RTLS, Building View and more. Machine Learning algorithms learn patterns in your data and can recognize custom events and trends. A complete separation of UI and API allows developers to write their own Front End or use the API independently. Post your own custom data or purchase one of the hundreds of sensor combinations Aretas produces. The Aretas IoT Cloud Platform has been around for almost 10 years and has undergone many transformations. We have learned from nearly a decade of experience in this business.

IoT Cloud Standard Software Features:

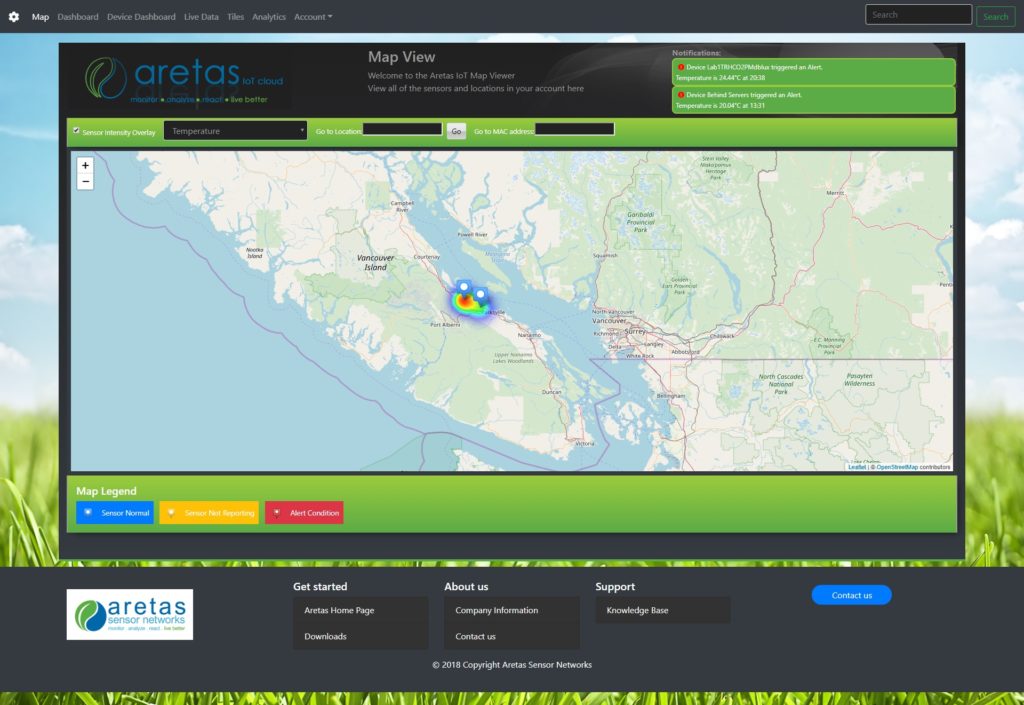
Main Map View

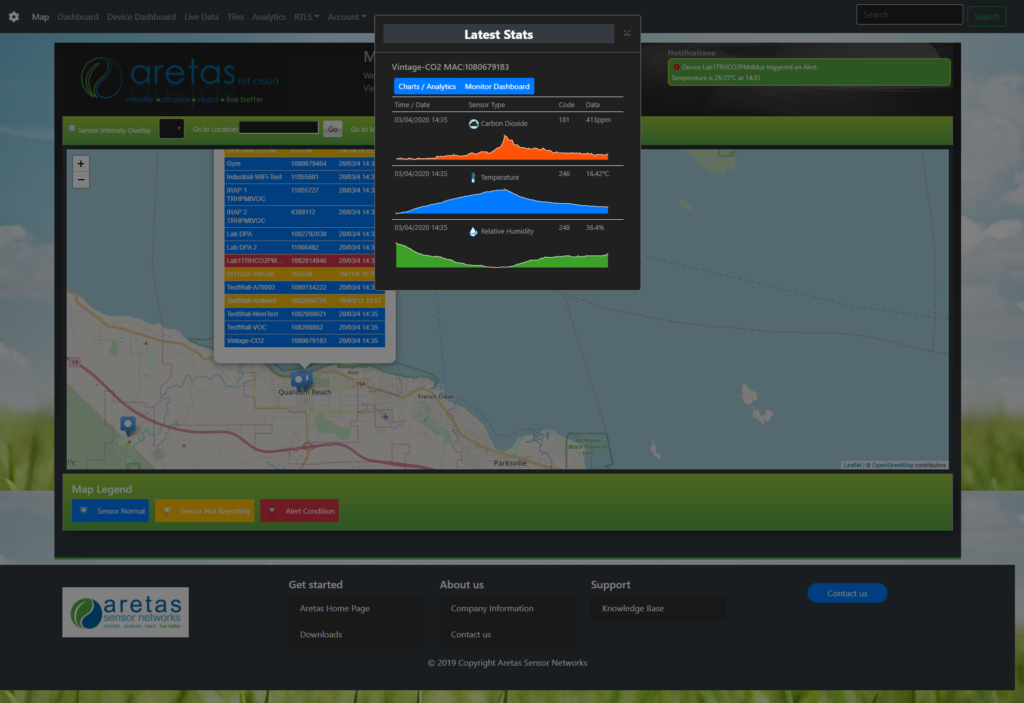
View all of your locations from one central map. Click on each map pin to view all of the sensors in that location. Click on each sensor to view the latest statistics. Click to go to the full sensor charting. Instantly view areas of concern as pins change color based on statuses of Strategies or Alerts.

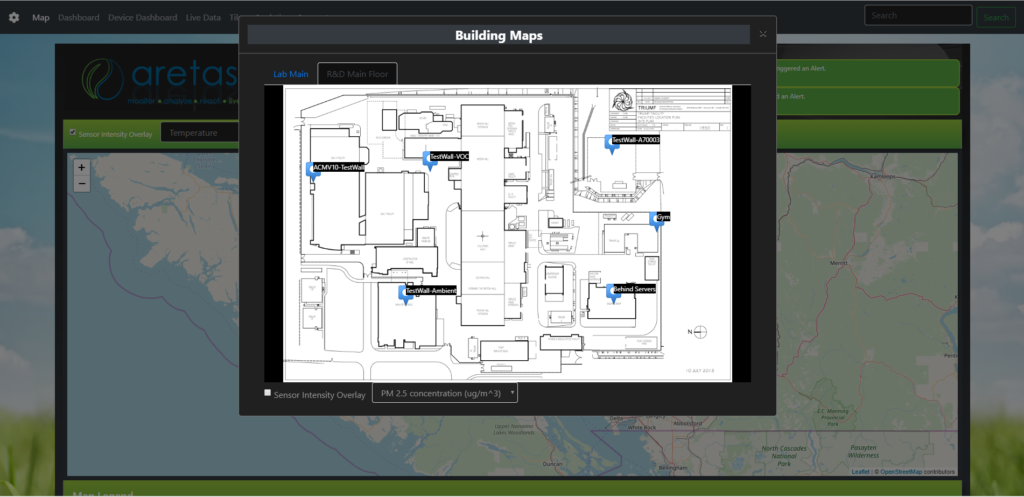
Building View

Building View allows you to attach building schematics, floor plans or other maps to a Location. This tab within the map view allows you to see where your sensors have been placed within your facility. Within the building view you can easily see when to turn on a ventilation or HVAC system, when to activate filtration such as Ozone treatment for cigarette smoke and much more

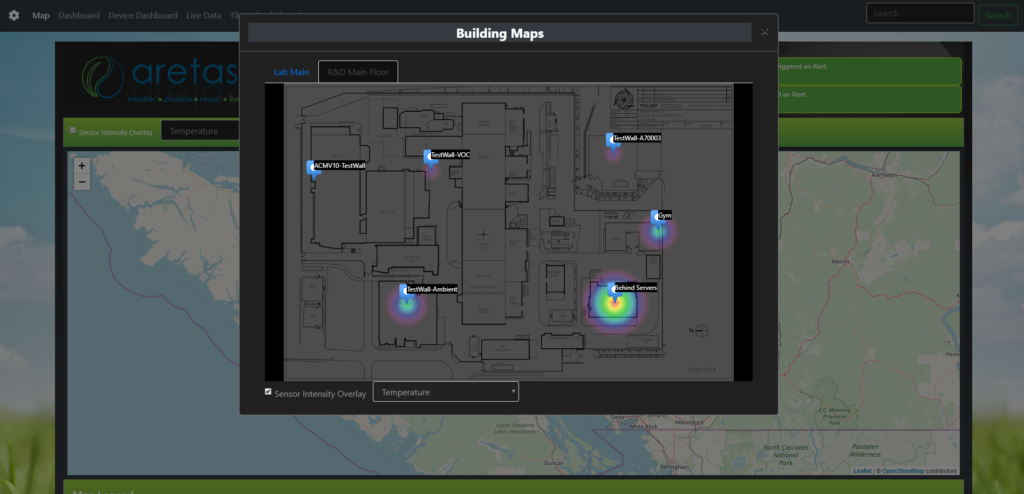
Sensor Intensity Maps

View sensor intensity maps by sensor type, which allow you to easily identify areas where gas concentrations are higher, temperatures are higher (or lower), noise is louder, or where more dust is accumulating. Types auto-enumerate based on the available sensors in a building map. 

Sensor Intensity Maps

View consolidated sensor intensity overlays for all your locations and see which locations have trouble spots or have high temperatures, high gas concentrations and more. Analyte types auto enumerate based on the sensors in the location. 

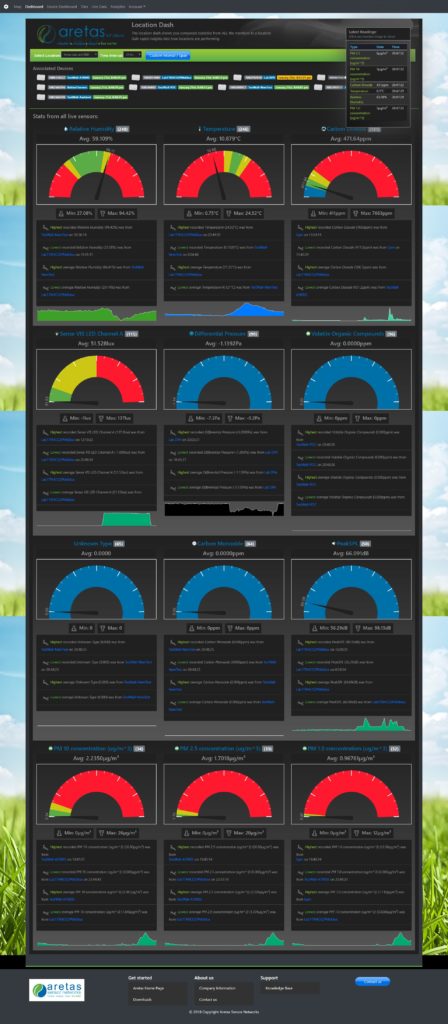
Location Dashboard

View aggregated statistics for a location and quickly see how locations are performing. View associated Devices, click to get most recent data. View highs and lows for each analyte and more! Generates consolidated statistics for ALL monitors in a location.

Sensor Dashboard

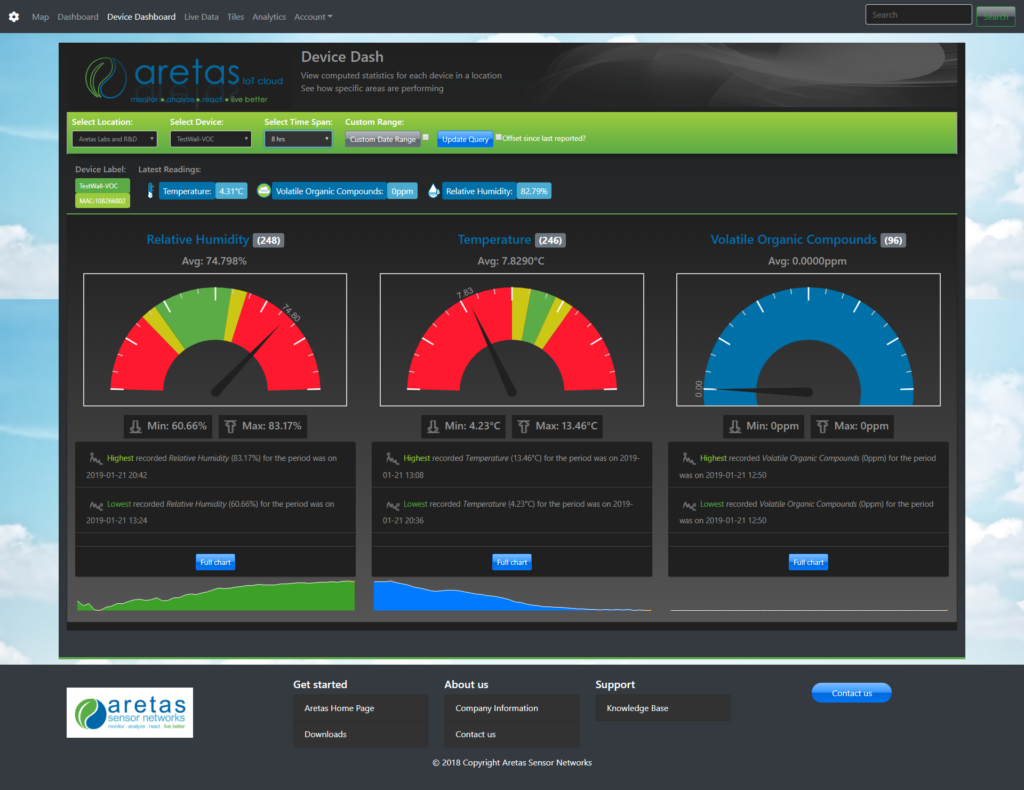
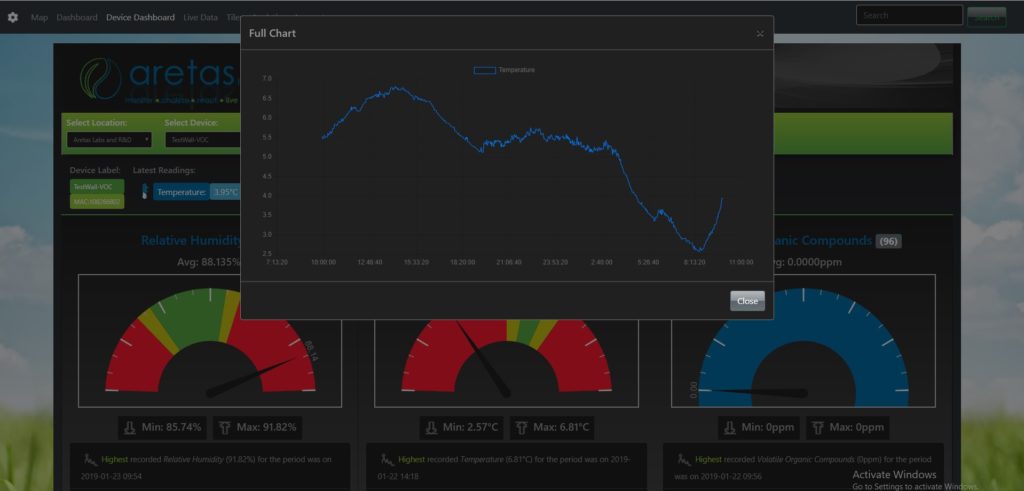
View individual sensor performance and up to data data. Get consolidated statistics over a period for a sensor. View sparkline data and full charts. Geo locates the closest sensor to you automatically. 

Live Data Feed

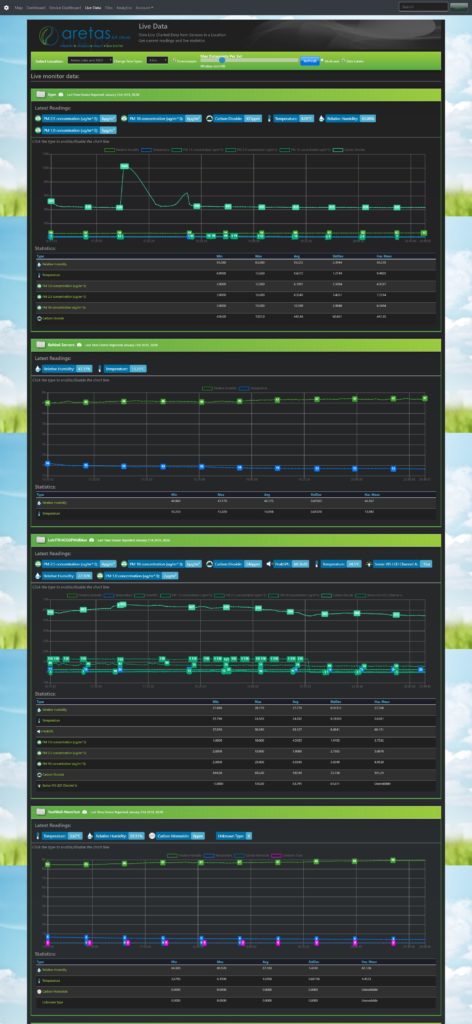
View the live data from your sensor network. Shows the current readings and charted data for the period. Choose multi-axis charting, compress data points and more. Lightning fast data queries

Dash Tiles

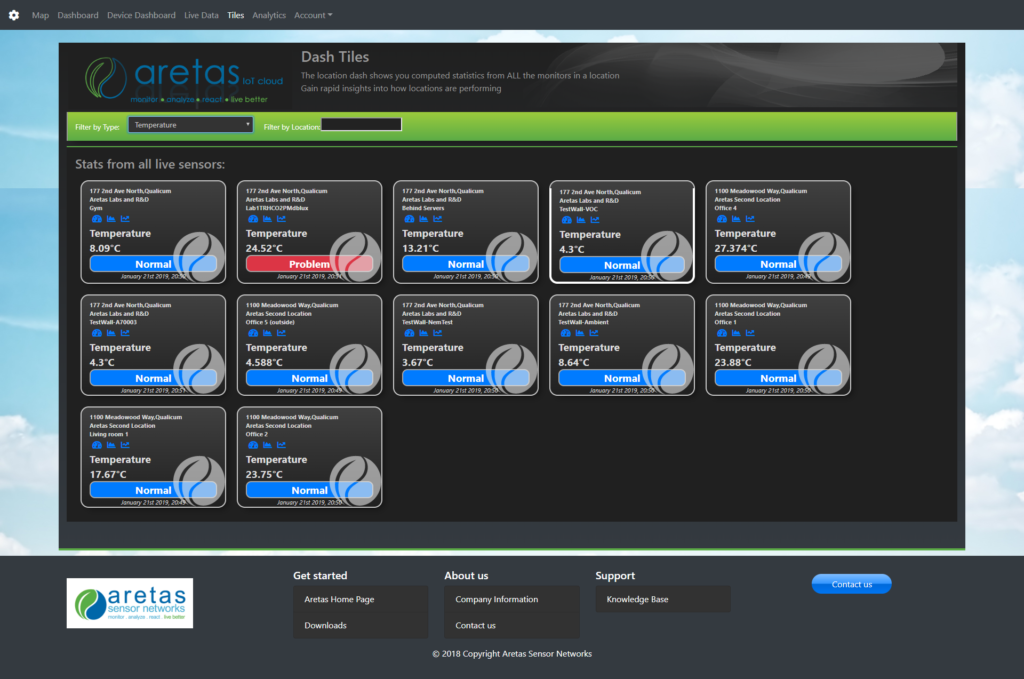
Dash tiles give you a comprehensive overview of your real time sensor data and alerts. Filter by sensor type and location. 

Instantaneous Real Time sensor data with less than 1s typical delay between origin of the device reading and availability in the UI (although most sensors typically report in 1-2 minute intervals). 

Forecasting / Prediction

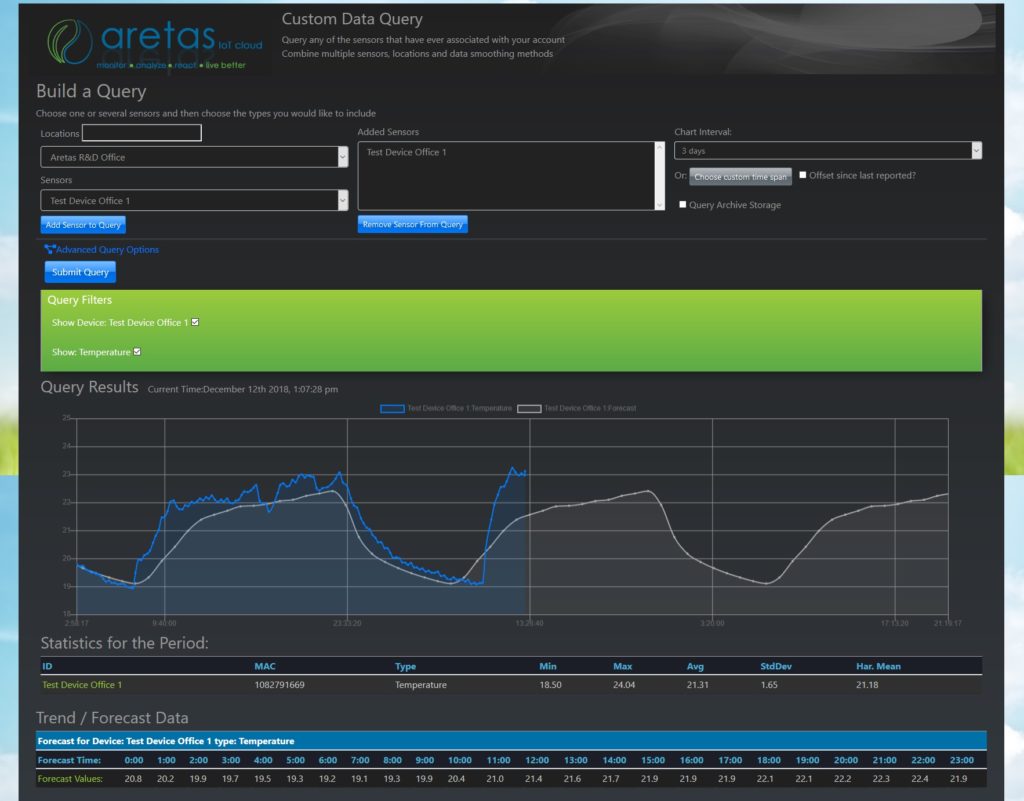
Perform automatic regression over existing data and perform forecasting / prediction (works with any sensor)

Analytics

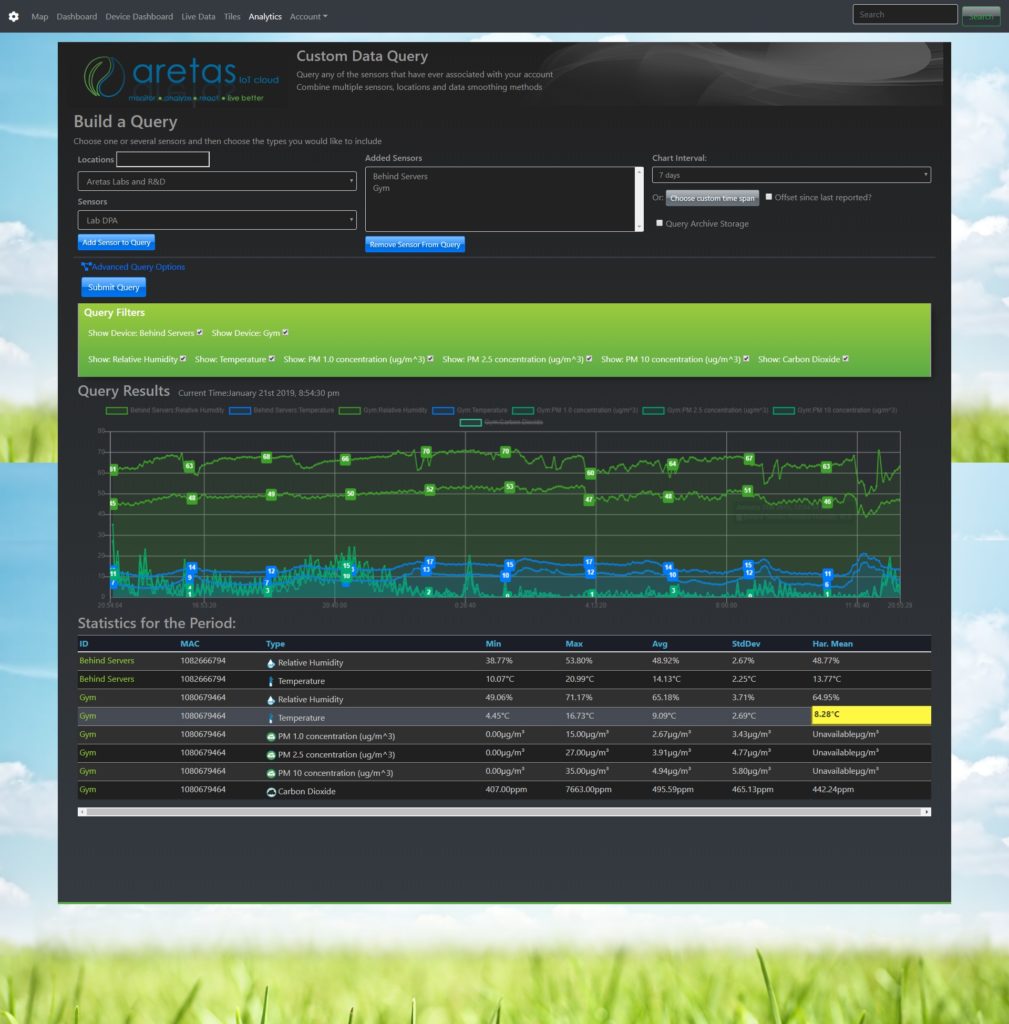
Query historical data for any sensor that’s ever reported to your account. Insanely fast data query engine can deliver multiple day sensor data queries (containing thousands of data points) in under 1 second. Download CSV exports, view computed statistics and more.
  • View Indexes such as Building Rating, Occupant Comfort, Heat Index, Mold Risk and more
  • Compare sensors from across your organization
  • Automatically generate relevant statistics
  • Much much more

Control Strategies

Control strategies allow you to ingest sensor data and execute control commands based on pre-defined thresholds. Implement thermostat control algorithms for an entire location. Implement demand controlled ventilation strategies, turn on lights or raise window shades. Aretas Control Devices offer 3 channels of on/off control per device. For thermostatic control, you can execute heat call, cooling call and fan control. 

Alerts

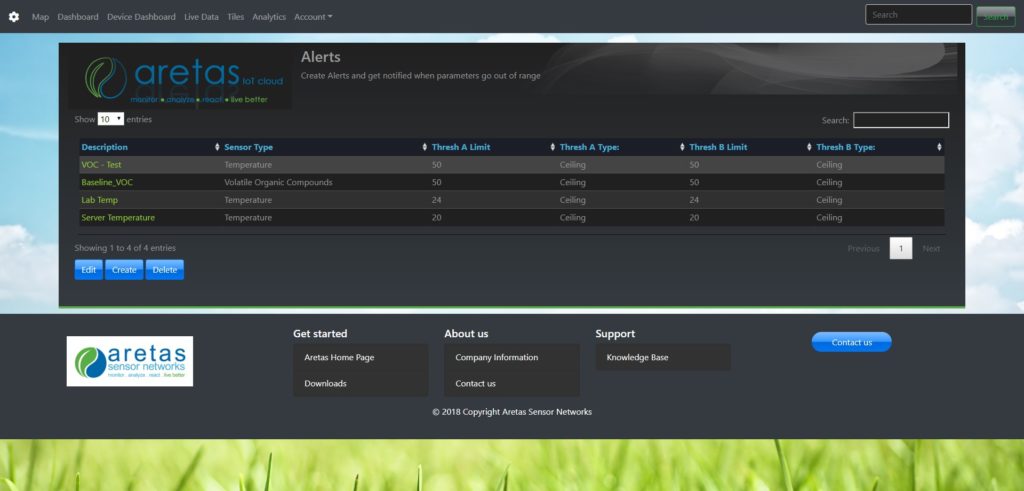
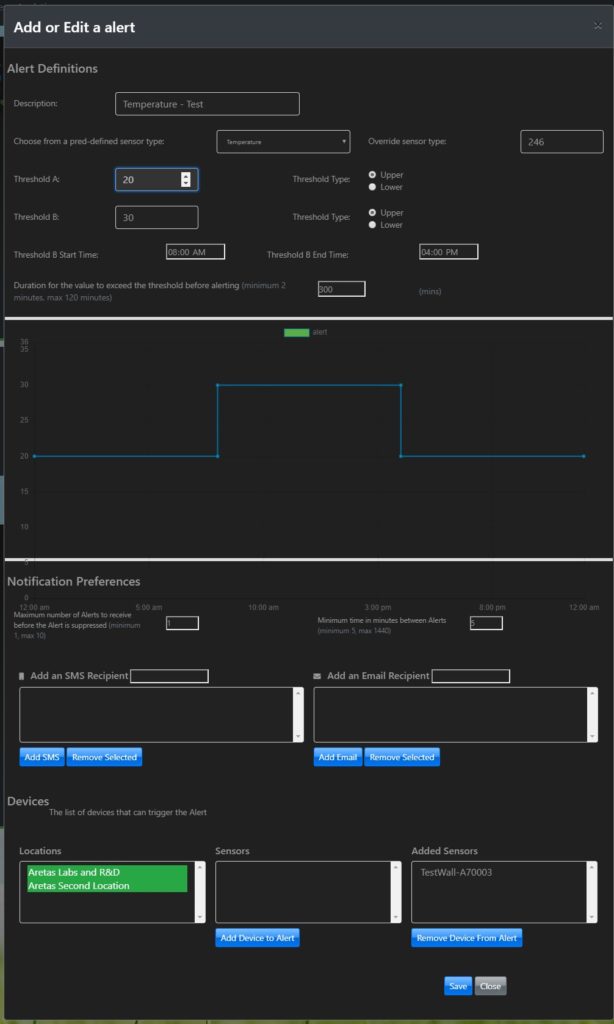
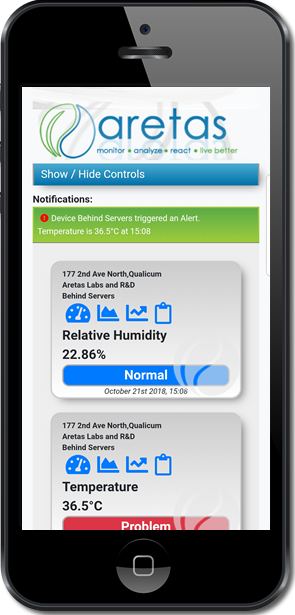
Alerts notify you when values exceed a certain threshold. Get notified by text, email and view the alerts in the web app and mobile app. Sensor statuses will turn red in both apps when the alert is triggered. You can set daytime/nighttime thresholds and alert when conditions go over or below thresholds. 

Mobile Friendly

Get the new mobile app from Google Play Store (coming soon for Apple). All the web pages are also mobile friendly and designed from the ground up for mobile compatibility (although workflow for strategies and alerts is more usable on desktop browser or tablet). 

Spectral Analysis

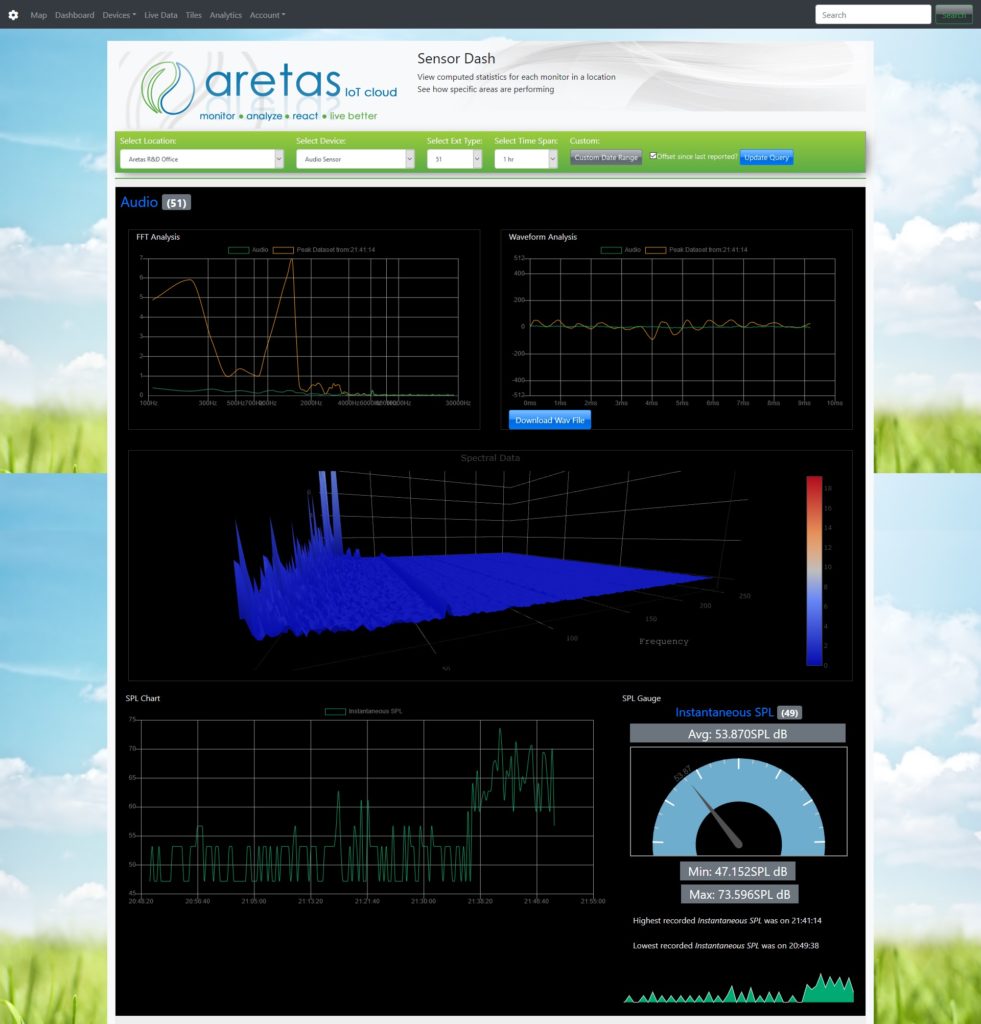
The only IoT Cloud Platform that supports spectral audio analysis from remote, low-cost, wireless sound sensors. Features include:
  • Animated FFT Analysis
  • Dominant Frequency Component identification
  • Animated Waveform visualization
  • Impulse Detection
  • SPL Time series analytics
  • 3D Time Domain Spectroscopy

Thermal Analysis

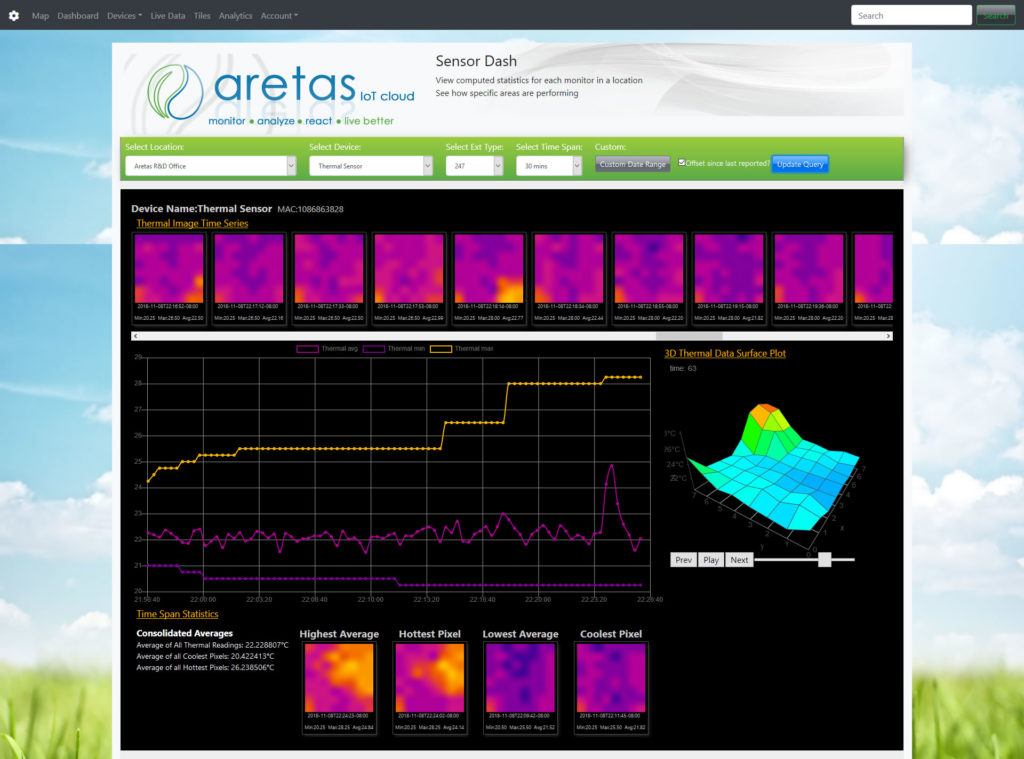
Place low cost thermal cameras throughout your facility or business and monitor motors, electrical panels, personnel and more. Aretas has the only Cloud based IoT platform capable of ingesting and processing low-cost thermal camera imagery. Our proprietary analytics system provides usable thermal imagery from our REST API based thermal interpolation system. Features include:
  • Time series storage of thermal imagery
  • Chart thermal features
  • View a time series of thermal images
  • Automatically pick out significant images
  • View individual pixel temperatures
  • Animated 3D surface plot
  • And more!

Supports Hundreds of Sensor Combinations

Works with most Aretas Sensors!

For additional advanced sensor support for sound spectrum, light spectrum, thermal and more, see the new Aretas Sensor Edge platform

Contact Us Today!

[pirate_forms]

Low starting prices