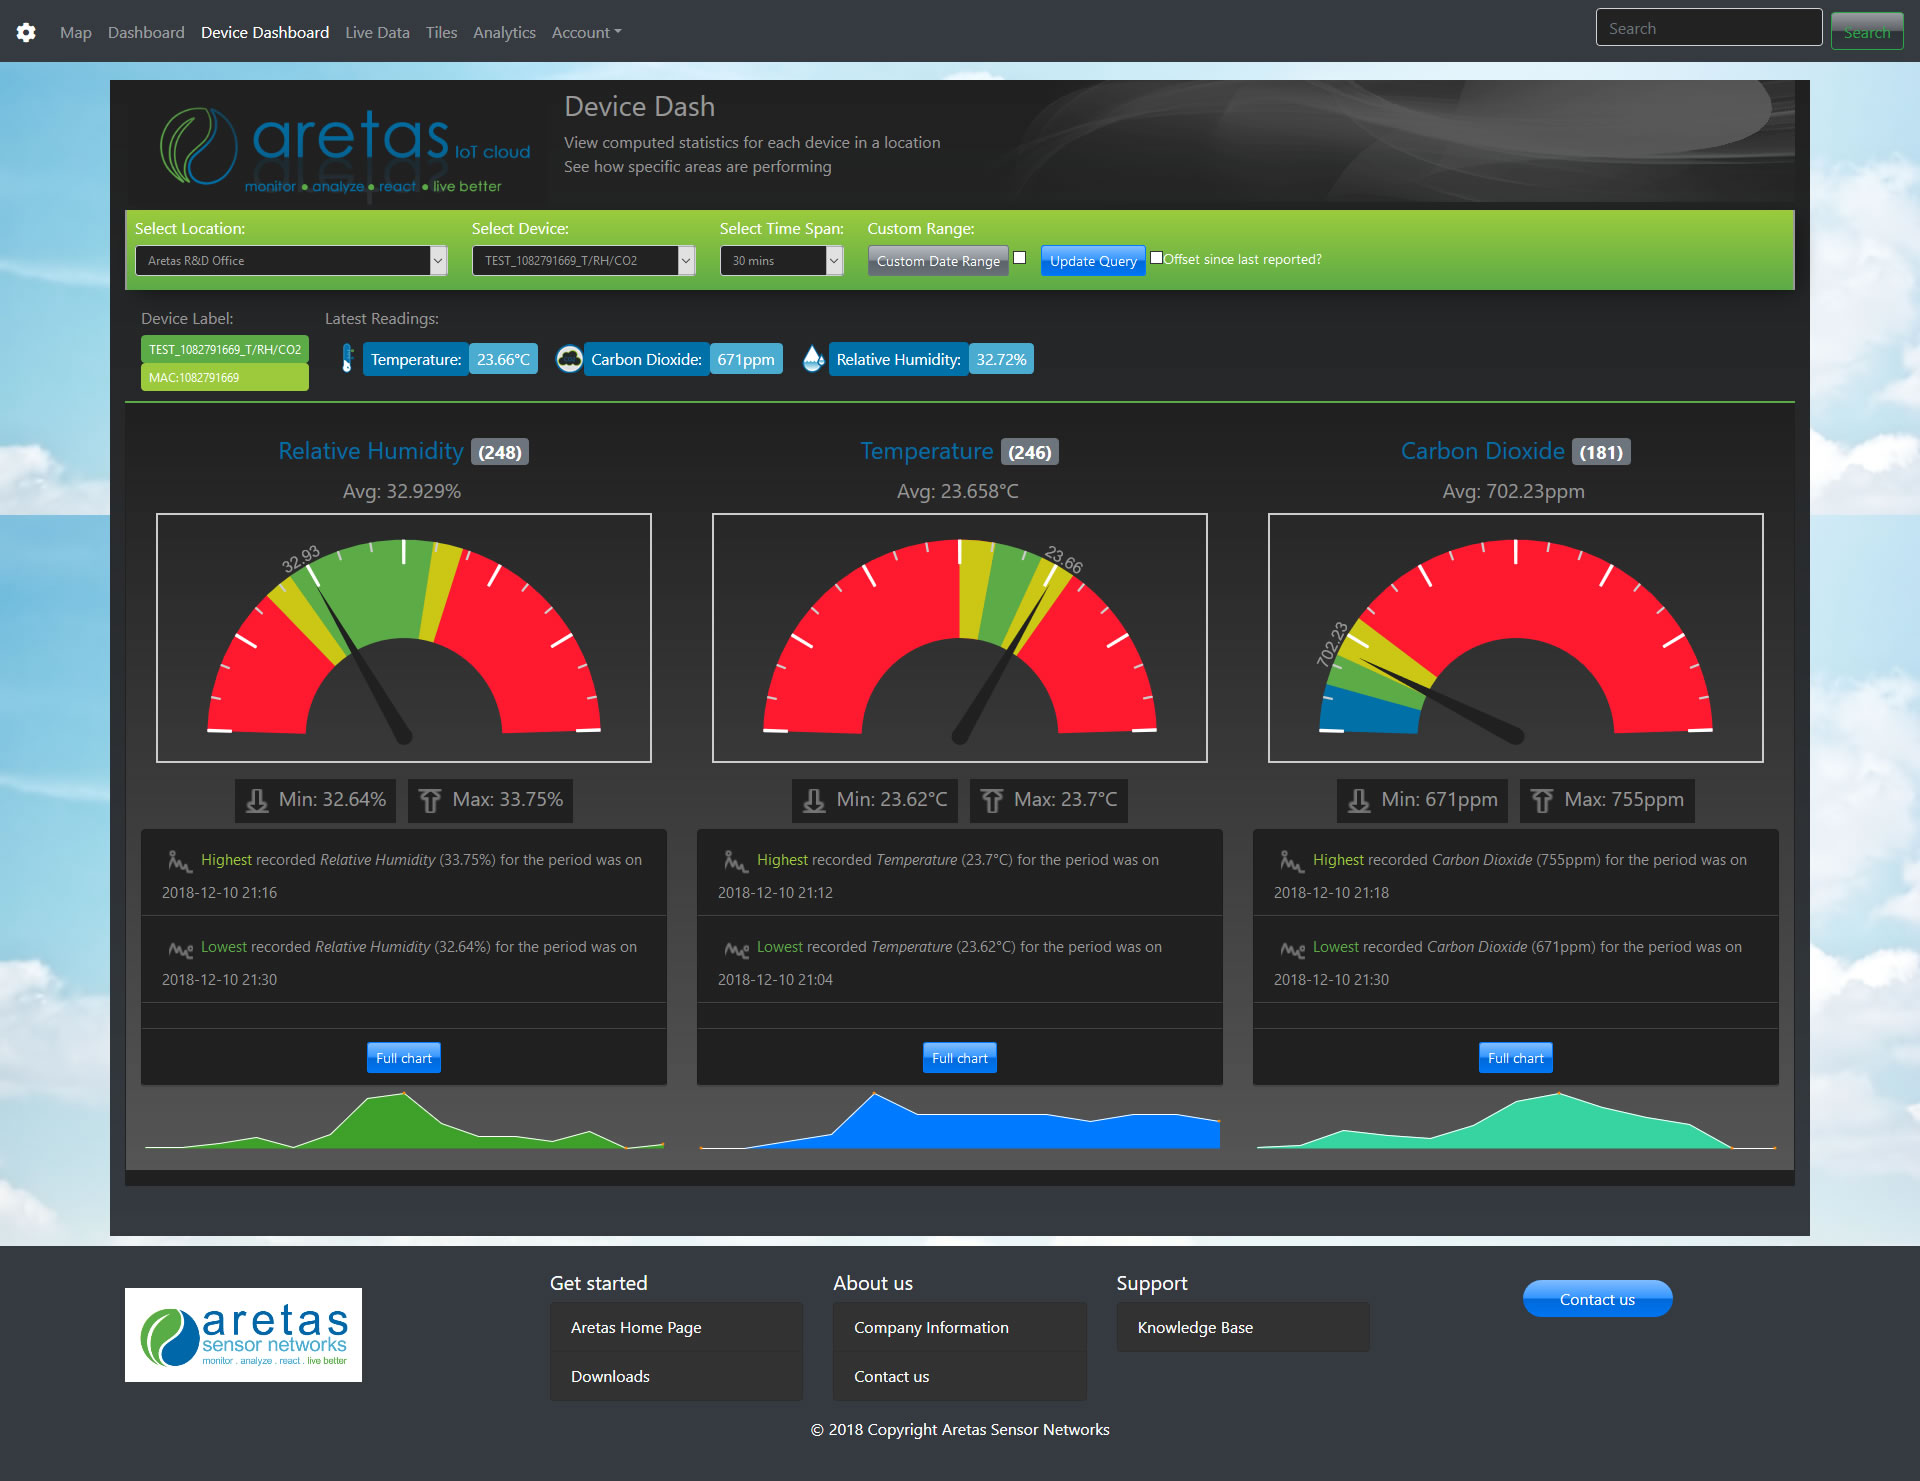
Dark Theme
The software UI will feature a new dark theme we feel is more pleasant to look at for longer periods of time (especially if you are using the software throughout the day like we do).
Predictive Analytics / Machine Learning / Forecasting
We have launched (in beta) the first phase of the Aretas predictive analytics suite. This includes several major features
- Predictive Indexes. This includes thermal comfort prediction, and IEQ comfort prediction taking into account other variables (light, noise, CO2, temperature and relative humidity). These indexes predict when people become uncomfortable when exposed to too much CO2 or elevated sound, decreased light, etc. We have also implemented the Heat Index for commercial and industrial clients.
- Forecasts. The analytics suite now learns the trends in your sensor data and can predict / forecast temperatures, CO2 levels and any other sensor data (carbon monoxide, occupancy, energy usage, etc). You can regress over large volumes of sensor data and develop trend curves and forecasts. You can use forecasts to predict many things such as office space usage, energy consumption trends, daily CO2 increases or even when the office bathroom is usually occupied. We will be dramatically improving our forecasting models over the coming months.
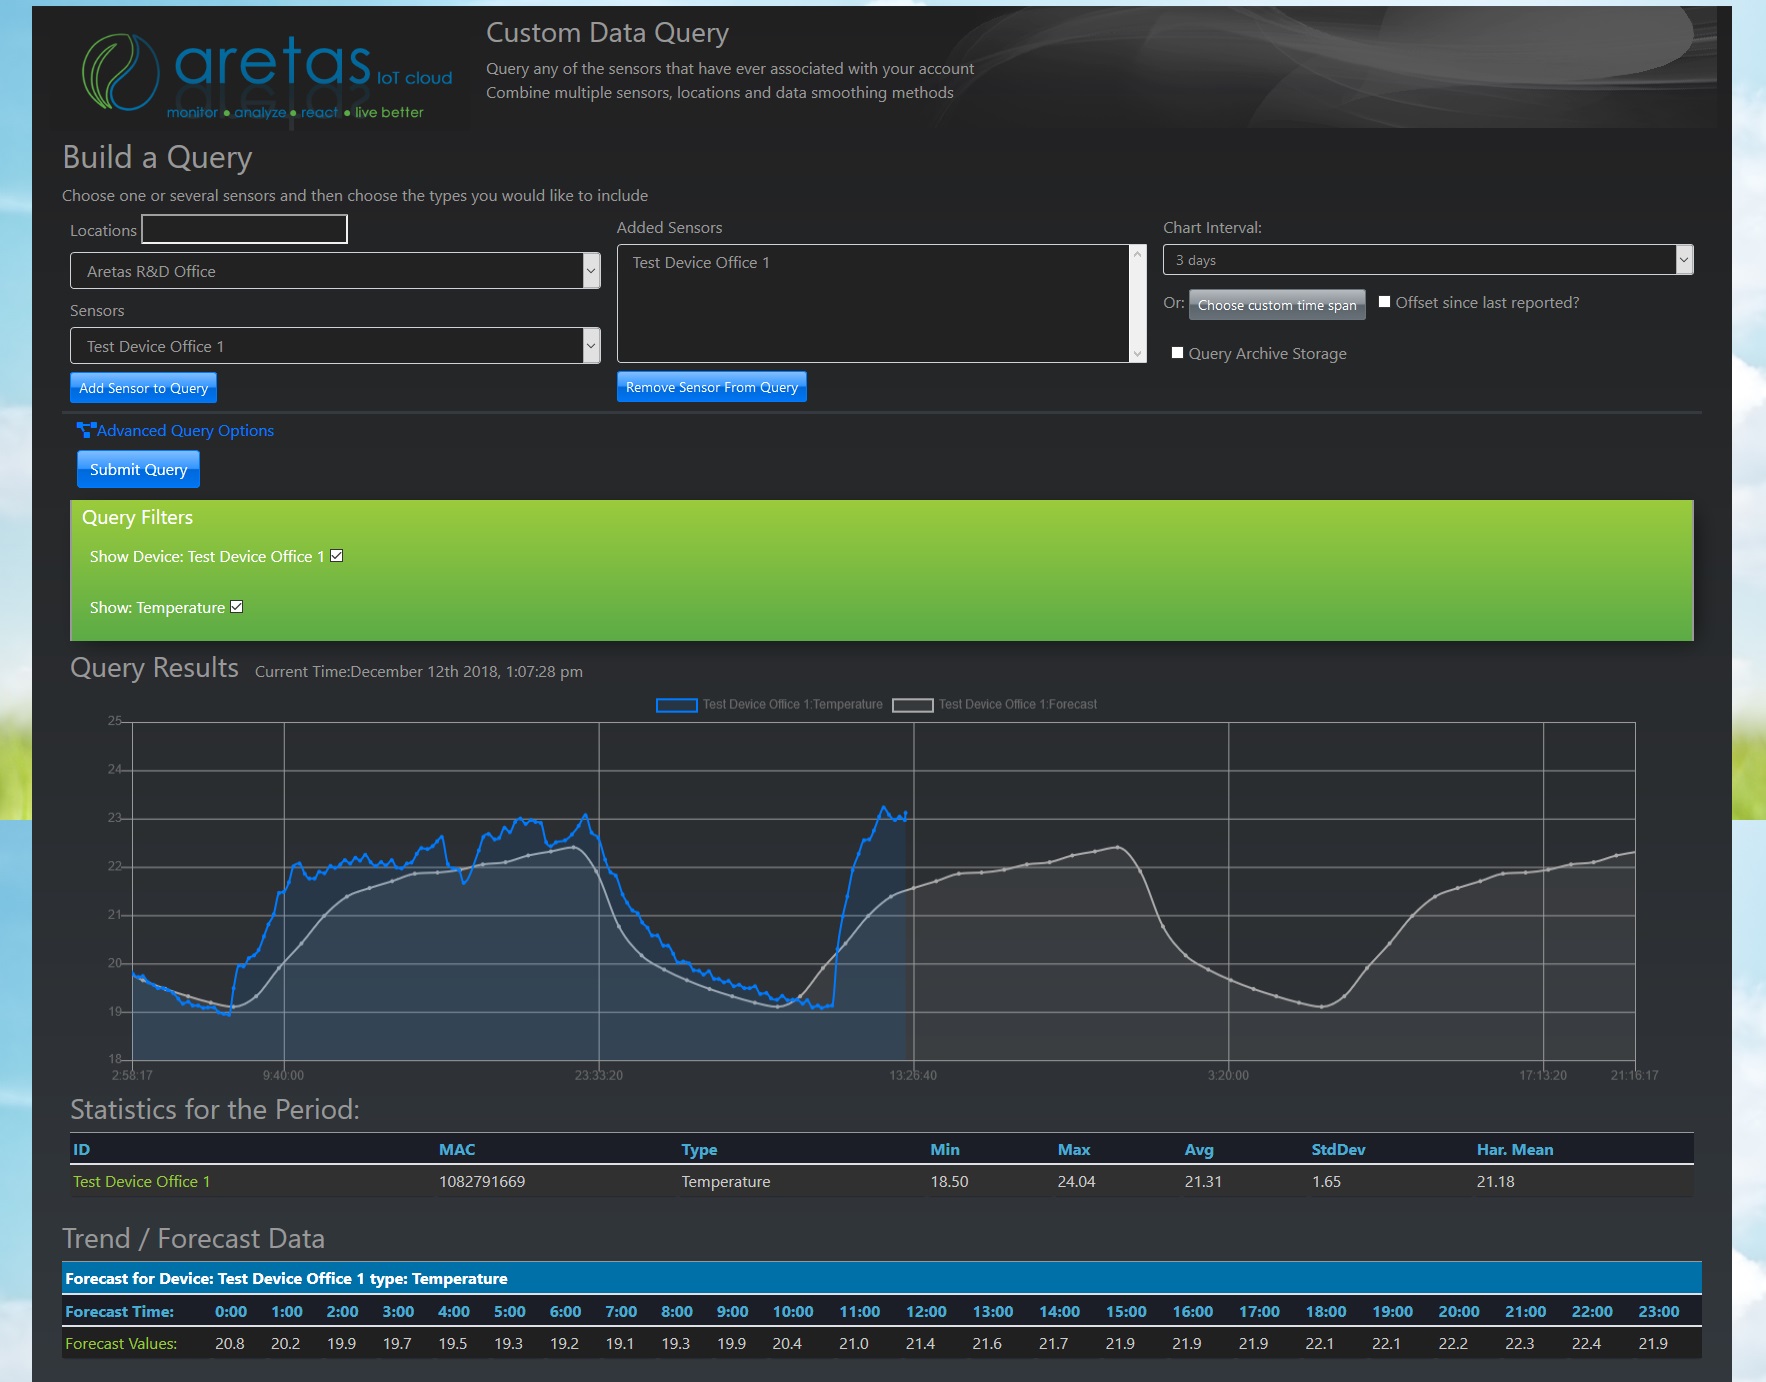
Example of forecasting temperature trends
Analytics Additions
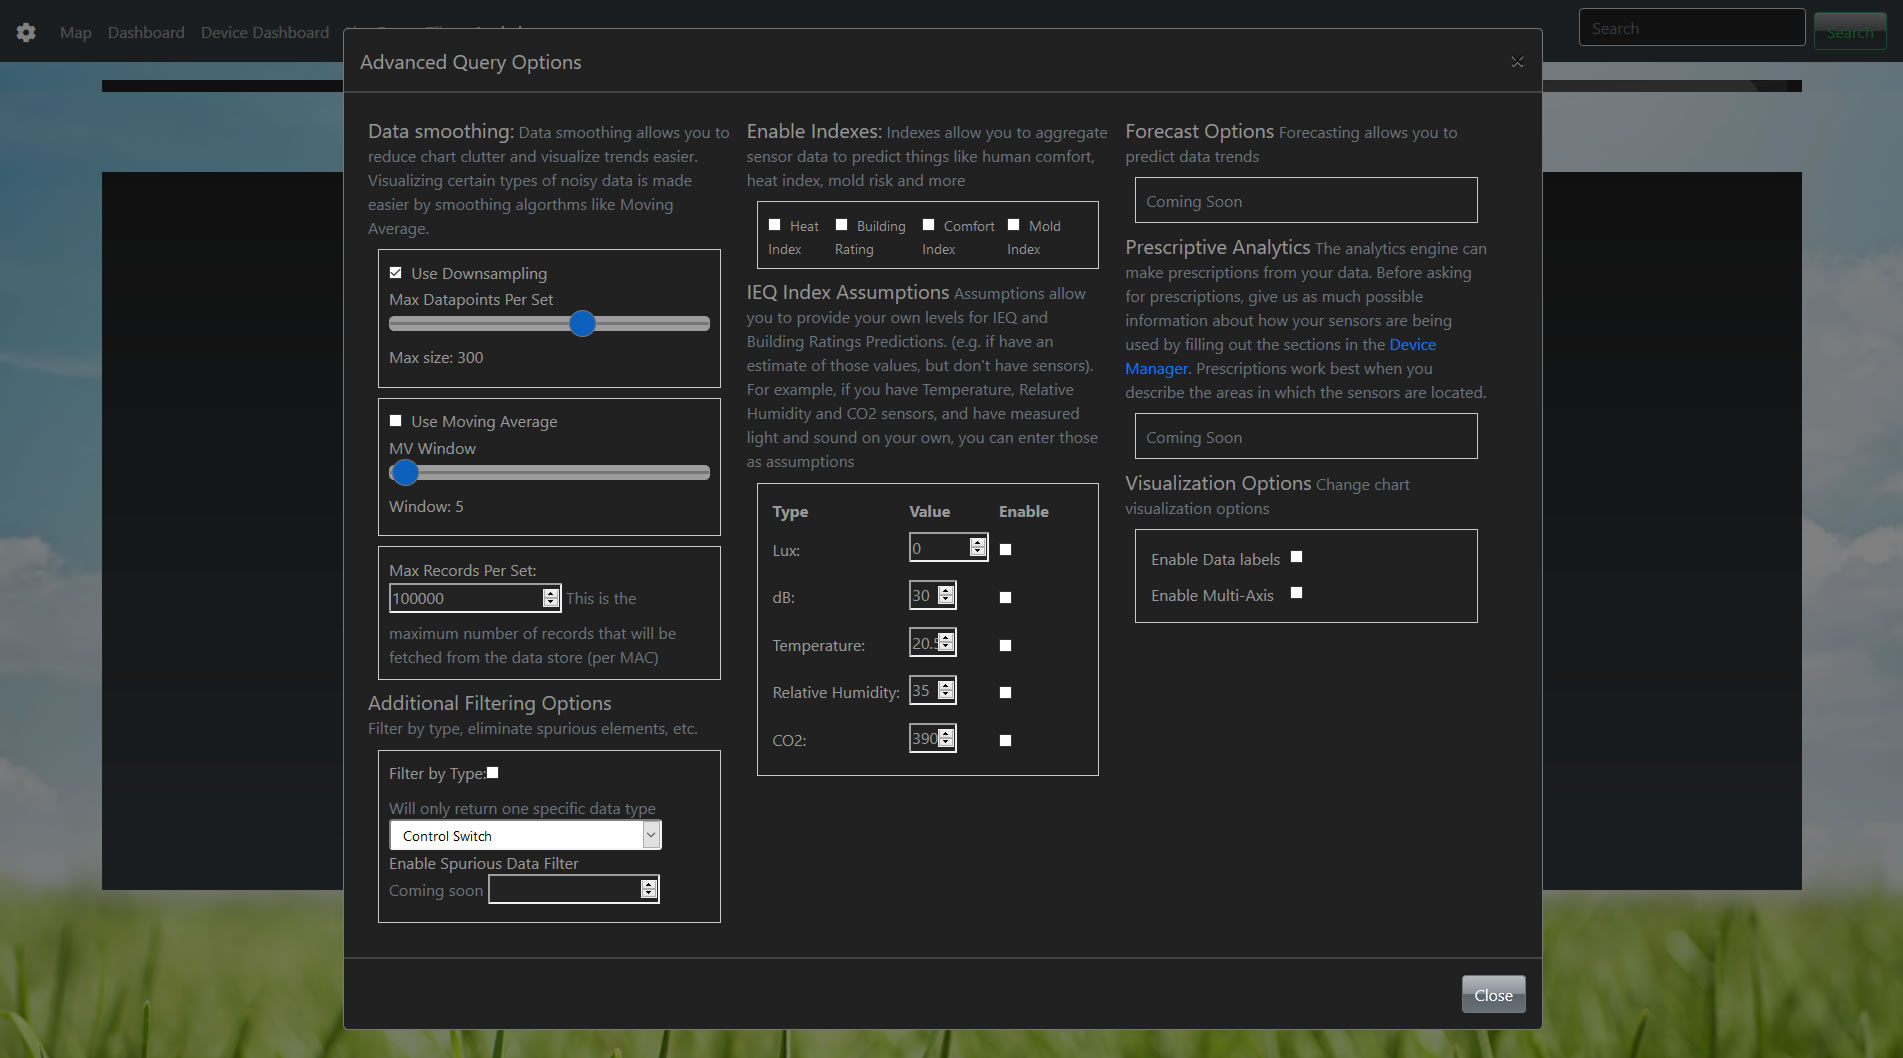
There are several new features to the analytics page, including
- The aforementioned predictive indexes
- The ability to provide index assumptions when you don’t have full sensor support
- Additional Data smoothing options
- Type filtering options
- Chart Data Labels and multi-axis charts
- Zoom and Pan on chart reports
Prescriptive Analytics
We are also launching the first phase of the prescriptive analytics feature, with additions to the Device Manager that enables users to provide the system more detail around how the Sensors and Devices are used in their space. If you would like to take advantage of prescriptive analytics when they fully launch, login to your Device Manager and fill out the advanced options for each of your devices to tell us how they are used.
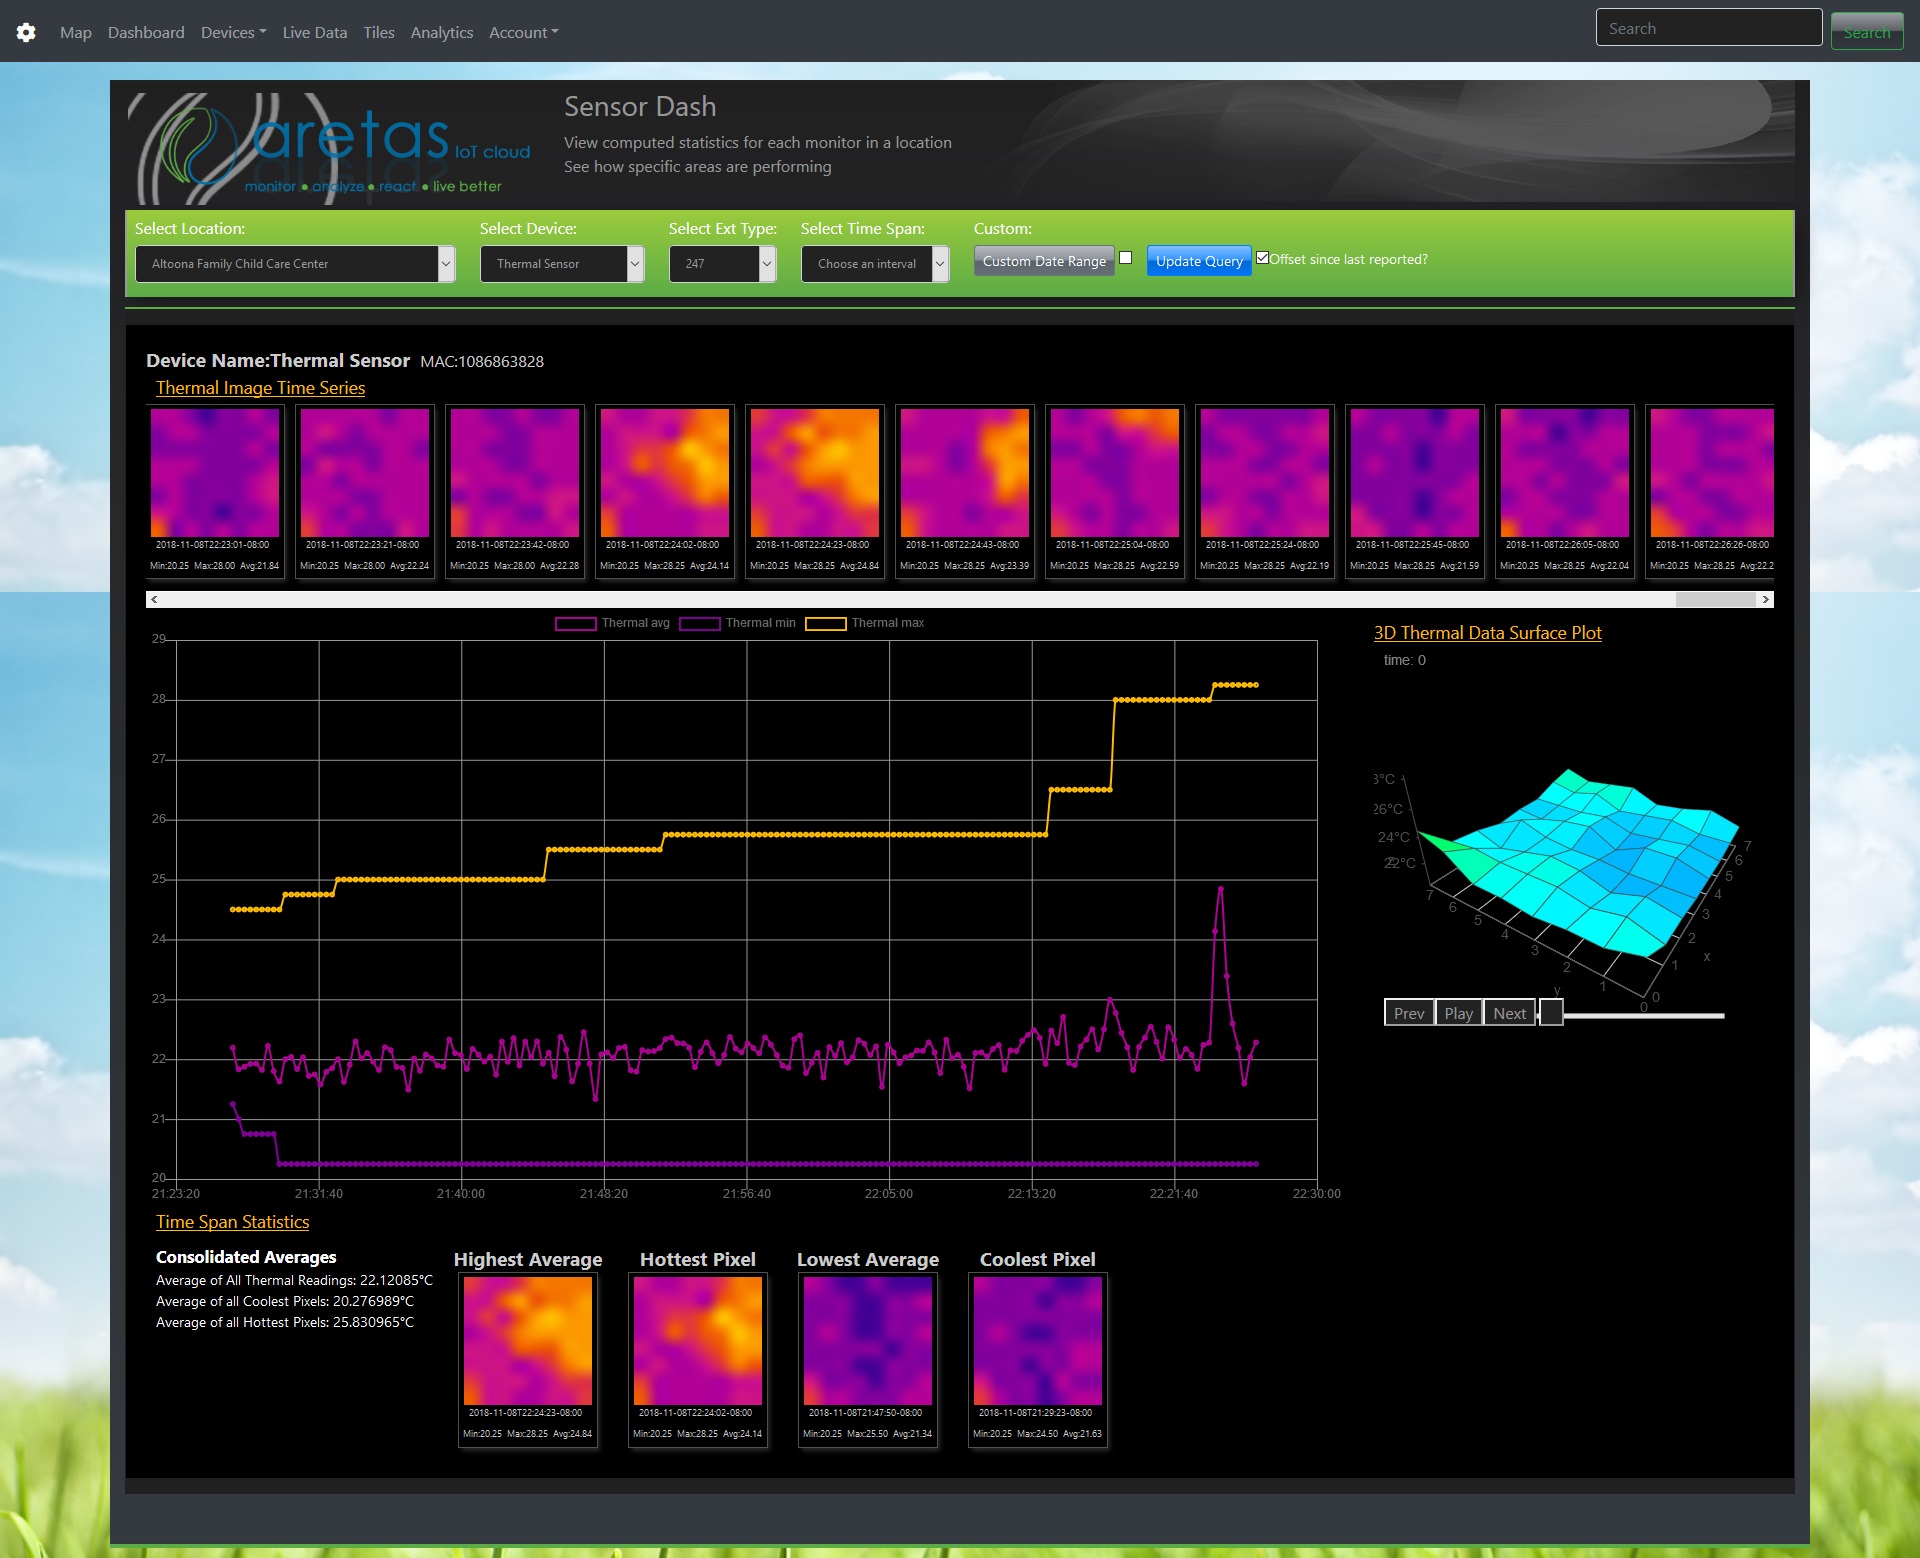
Thermal Analytics Live
We have launched the Thermal Analytics feature which can process radiometric temperature data from small array thermal cameras and provide time series analytics. Behind the scenes, this technology will be used to provide thermal alerting and additional machine learning features. Customers can use this technology now to monitor anything from electrical panels to large industrial motors to seeing if the stove has been left on.
Misc Updates
Many other fixes and updates were added.
- Live data page now supports location filtering
- Live data page now supports multi-axis charts and chart data labels
- Data Archive search feature added
- Device Dashboard Full charts are much more usable / responsive
- Back end queueharvester overhaul to improve message processing times by 10x

0 Comments