Outlier Filtering
Sometimes a random fluctuation or excessively high sensor reading can enter your data set. Outlier filtering helps clean up the data and make your charts more legible and also helps get rid of spurious data points that don’t belong.
Example:
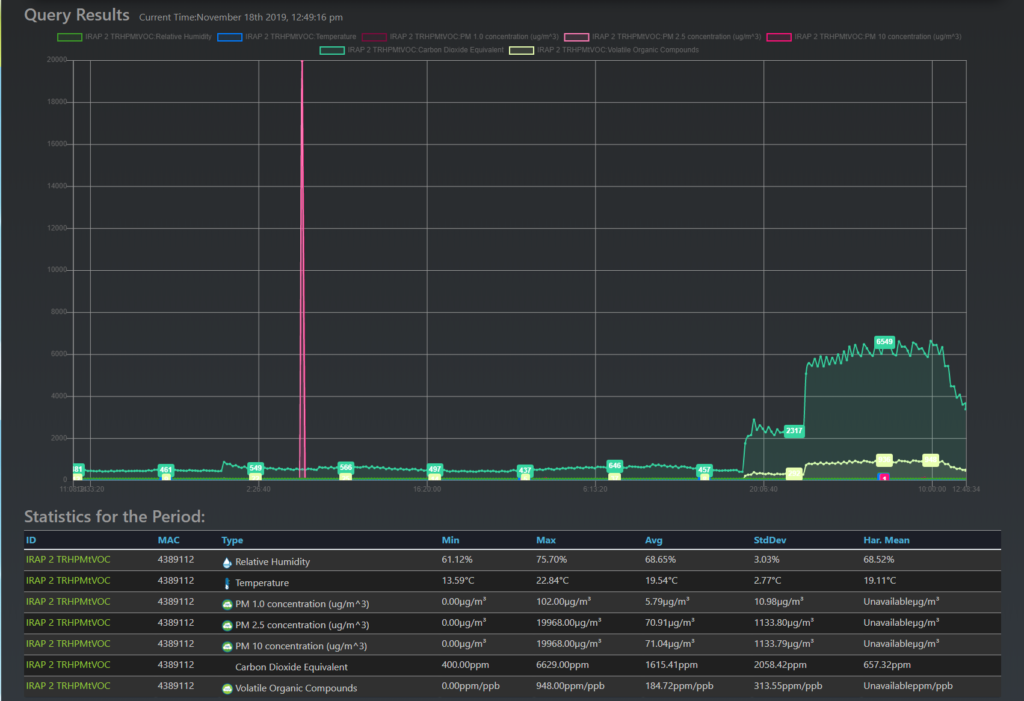
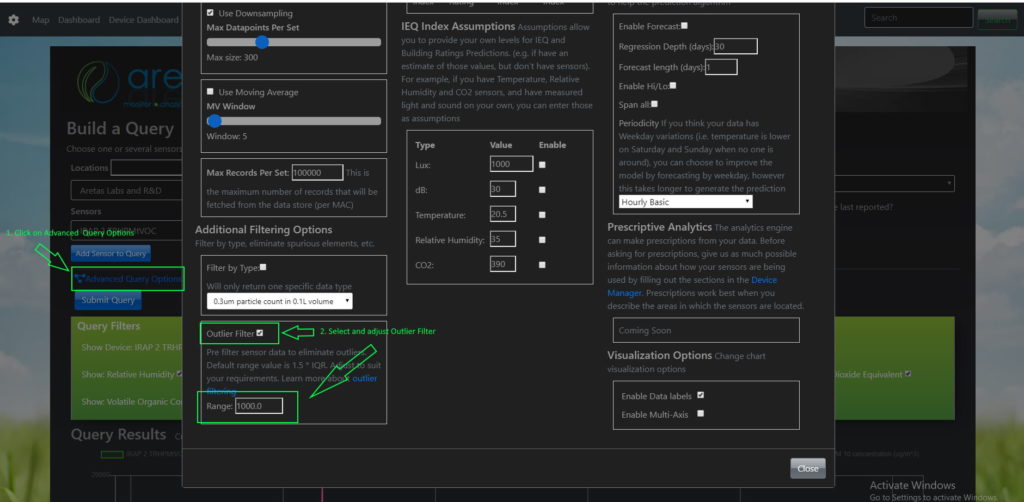
The pink spike indicates a spurious reading from a particulate sensor. To get rid of it, click on “Advanced Query Options” on the Analytics page and Enable the Outlier Filter. You may want to adjust the Outlier filter depending on the magnitude of the value and your mean values. In this case we chose to increase the default value from 100 to 1000. You may wish to experiment based on your data set.
The resulting query with Outliers filtered:
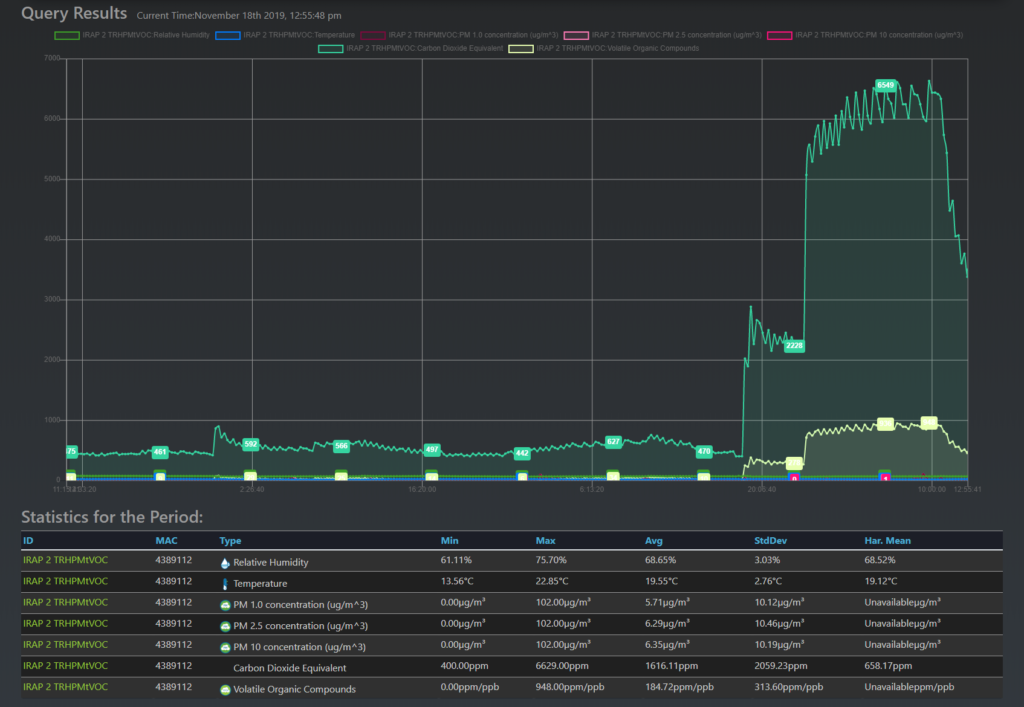
Outlier filtering is a great way to get rid of unrealistic readings or errors in your sensor data.
The Outlier Filter is also available in the REST API.
0 Comments